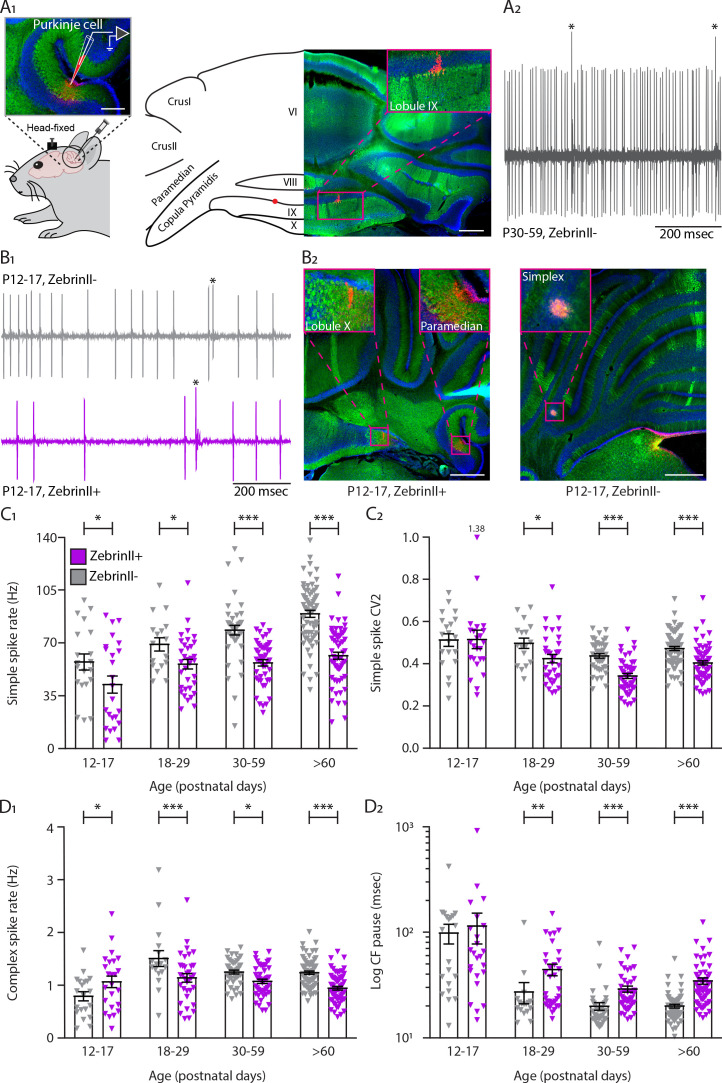
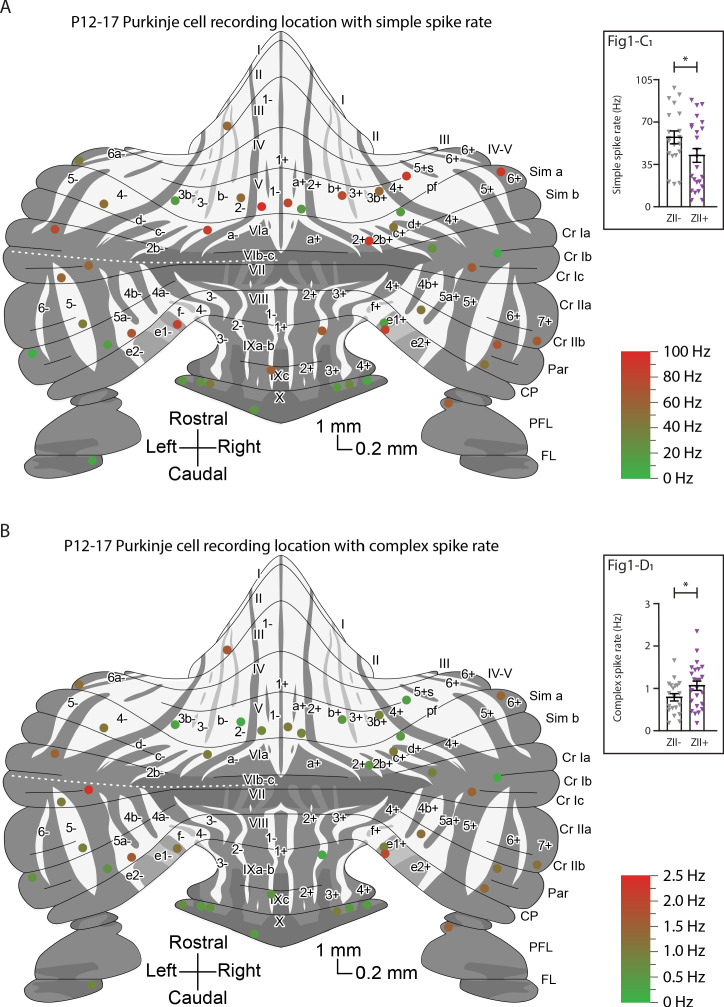
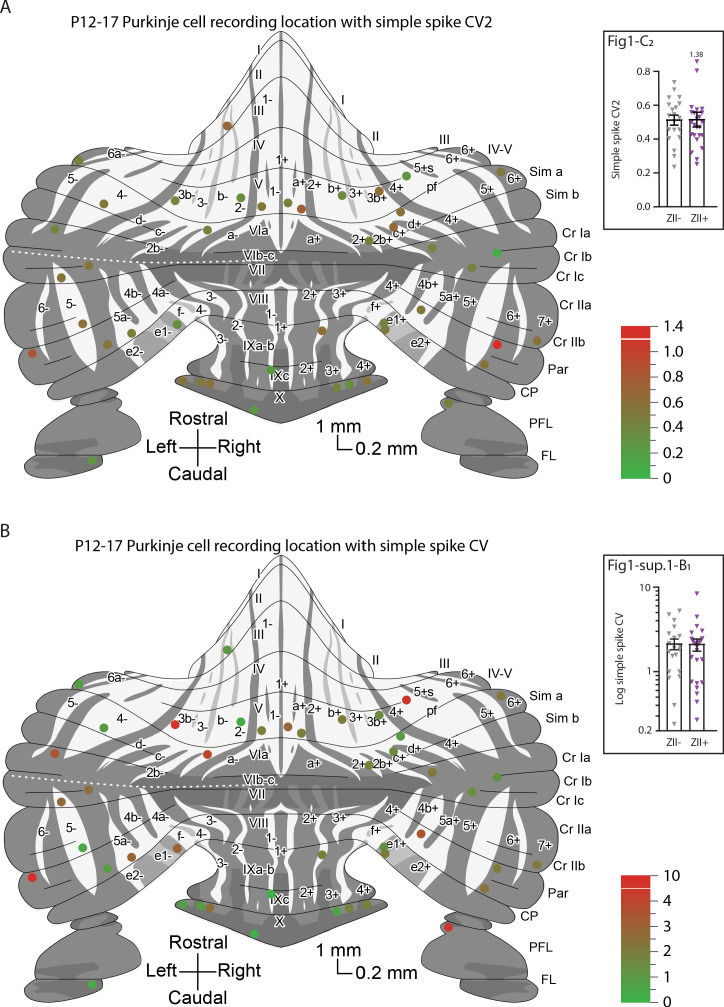
Figure 1. Simple and complex spike activity develops differently between ZebrinII-related Purkinje cell populations.
(A1) Schematic illustration of single unit cerebellar extracellular recordings in Purkinje cells of awake head-fixed mice (left). Schematic representation of a cerebellar coronal section and respective image showing lobules VI, VIII, IX and X, Crus I, Crus II, Paramedian, and Copula Pyramidis. Cerebellar coronal section with PCs labeled with Aldolase C (green). Inset showing recording site marked with biocytin (red) in lobule IX (right). (A2) Example trace of in vivo P30-59 ZebrinII– Purkinje cell recording identified by its hallmark feature, the occurrence of complex spikes (asterisks) and simple spikes. (B1) Example traces of extracellular Zebrin– and Zebrin+ Purkinje cell recordings at P12-17 with clearly distinguishable simple spikes and complex spikes (asterisks). (B2) Photomicrographs of coronal sections with examples of ZebrinII+ (left) and ZebrinII– (right) P12-17 Purkinje cells in lobule X, Paramedian, and Simplex, respectively. Purkinje cells are labeled with Aldolase C (green). Insets showing recording sites marked with biocytin (red) in lobule X, Paramedian (left) and Simplex (right). (C1) Purkinje cell simple spike firing rate, (C2) coefficient of variation 2 (CV2) for simple spikes, (D1) complex spike firing rate and (D2) Climbing fiber pause recorded in vivo for ZebrinII– Purkinje cells (gray) and ZebrinII+ Purkinje cells (purple) in four age groups. Age groups: P12-17, P18-29, P30-59, and >P60. Error bars represent SEM., for values see Supplementary file 1. * denotes p<0.05, **p<0.001 and ***p<0.0001. Scale bars = (A1) 100 µm (left), 500 µm (right), and (B2) 500 µm.
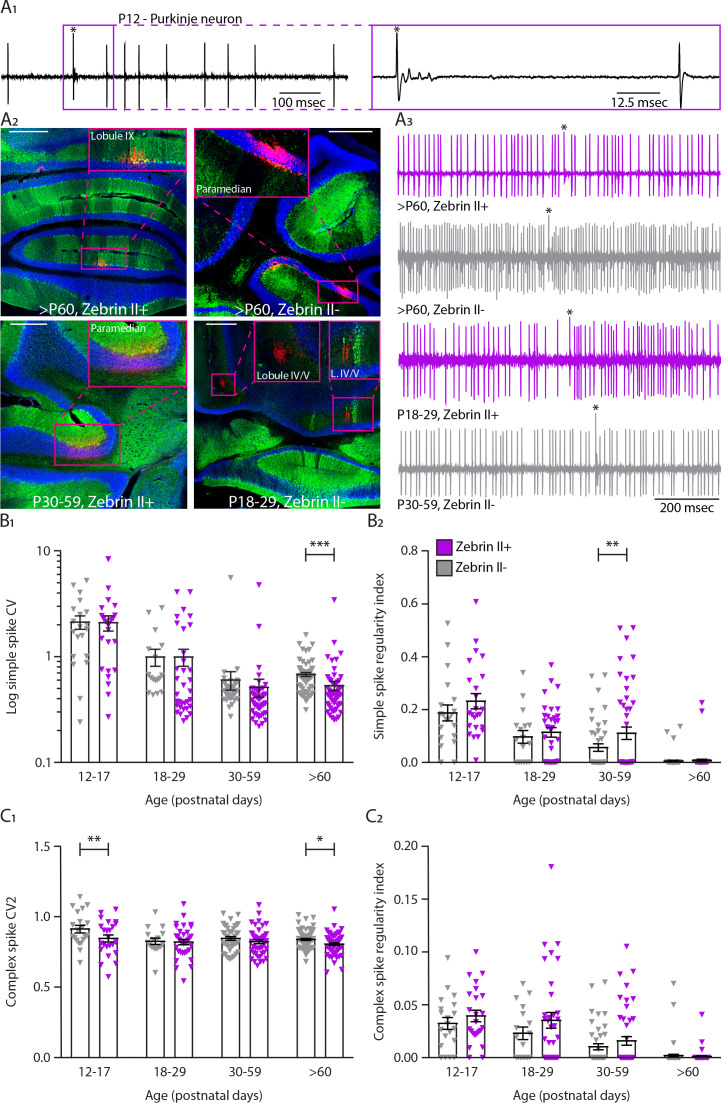
Figure 1—figure supplement 1. In vivo extracellular recordings of simple and complex spike activity in different ZebrinII-related Purkinje cell populations during development.
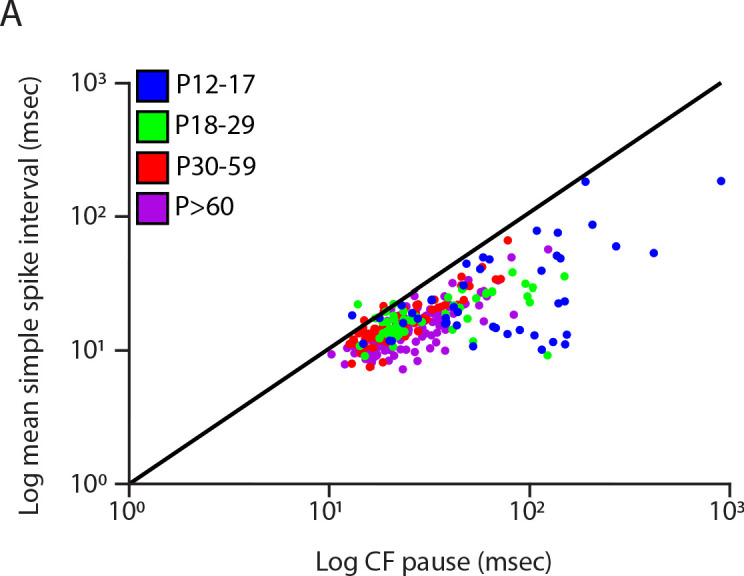
Figure 1—figure supplement 2. Climbing fiber pause is longer than inter-simple spike-interval in the majority of the recorded cells.
