. 2021 May 11;10:e63668. doi: 10.7554/eLife.63668

Figure 2. Intrinsic activity develops differently between lobule III and lobule X Purkinje cell populations.

(A1) Cell-attached recordings in vitro in Slc1a6-EGFP mice that express eGFP in Purkinje cells. Recordings of intrinsic Purkinje cell activity were made in lobules III and X. Purkinje cells were identified by the size of the soma (asterisk) clearly visible in the Purkinje cell layer. (A2) Example traces of cell-attached recordings of lobule III and X Purkinje cells at P6-9 and P18-29. (B1) Purkinje cell intrinsic simple spike rate and (B2) coefficient of variation 2 (CV2) recorded in vitro for lobule III Purkinje cells (gray) and lobule X Purkinje cells (purple) in seven age groups. Age groups: P3-5, P6-9, P10-11, P12-17, P18-29, P30-59, and >P60. Error bars represent SEM, for values see Supplementary file 1. * denotes p<0.05, **p<0.001, and ***p<0.0001. Scale bar = (A1) 500 µm.

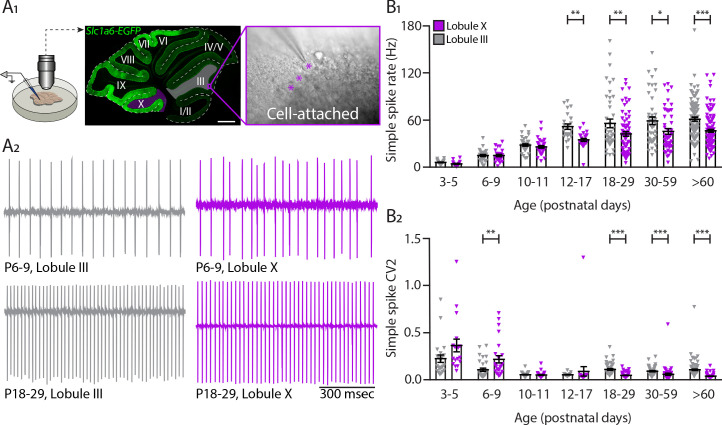
Figure 2—source data 1. Purkinje cell in vitro source data 1.

Figure 2.

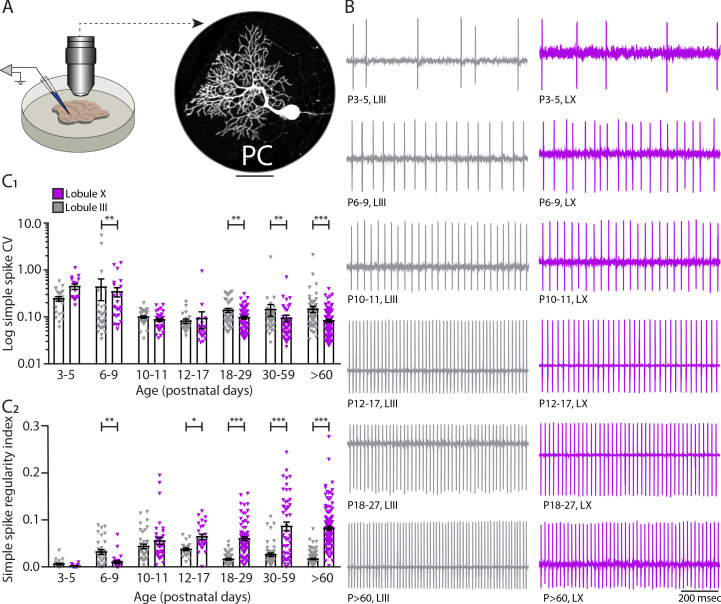
Figure 2—figure supplement 1. In vitro cell-attached recordings of intrinsic activity in different Purkinje cell populations during development.

Figure 2—figure supplement 1.

(A) Schematic of cell-attached recordings in vitro in lobules III and X (left) and example of a Purkinje cell filled with biocytin and stained afterwards (right). (B) Example traces of cell-attached recordings of lobule III and X Purkinje cells at different developmental ages. (C1) Purkinje cell coefficient of variation (CV) and (C2) regularity index recorded in vitro for lobule III Purkinje cells (gray) and lobule X Purkinje cells (purple) in seven age groups. Age groups: P3-5, P6-9, P10-11, P12-17, P18-29, P30-59, and >P60. Error bars represent SEM., for values see Supplementary file 1. * denotes p<0.05, **p<0.001, and ***p<0.0001. Scale bar = (A) 50 µm.
Figure 2—figure supplement 2. Lobule III and ZebrinII– Purkinje cell simple spike rate results from a higher intrinsic and input driven component when compared with lobule X and ZebrinII+ Purkinje cells.

Figure 2—figure supplement 2.

(A1) Purkinje cell intrinsic simple spike rate recorded in vitro for lobule III Purkinje cells (gray) and lobule X Purkinje cells (purple) and Purkinje cell simple spike firing rate recorded in vivo for ZebrinII– Purkinje cells (gray) and ZebrinII+ Purkinje cells (purple). (A2) The input-driven spike rate is represented by delta-spike rate for ZebrinII– Purkinje cells (gray) and ZebrinII+ Purkinje cells (purple). Age groups: P3-5, P6-9, P10-11, P12-17, P18-29, P30-59, and >P60. Error bars represent SEM., for values see Supplementary file 1. * denotes p<0.05, **p<0.001, and ***p<0.0001.