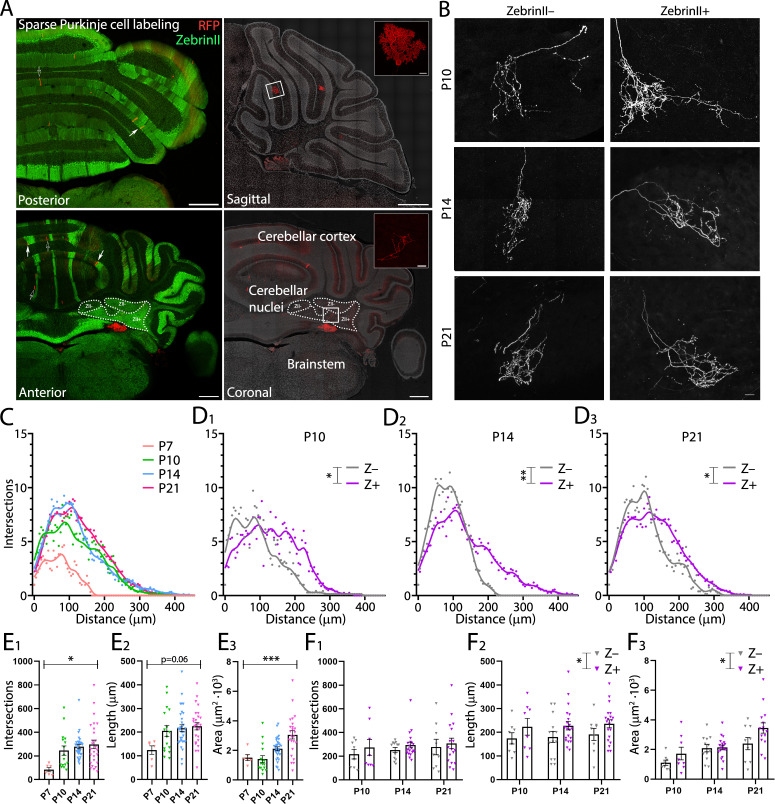
Figure 5. ZebrinII+ Purkinje cell axons are larger and less dense at all early postnatal ages.
(A) Photomicrographs of cerebellar sections demonstrating sparse labeling of Purkinje cells. Left panels are stained with antibodies against ZebrinII as well as red fluorescent protein (RFP) to label Purkinje cells expressing RFP. Right panels are stained with DAPI and RFP to show examples of Purkinje cells and Purkinje cell axon arbors (top inset and bottom inset, respectively) in sagittal and coronal cerebellar sections (top and bottom right panels, respectively). (B) Photomicrographs of example ZebrinII– and ZebrinII+ axon arbors from P10, P14, and P21 mice. (C) Sholl analysis of all axon arbors at P7, P10, P14, and P21, average crosses are indicated with points and fitted with a smoothed line. (D1-3) Sholl analyses of ZebrinII– and ZebrinII+ groups of axons at P10, P14, and P21, respectively. (E1) Total number of intersections, (E2) longest dendrite length and (E3) axon arbor area analysis for all axons at different ages. (F1) Total number of intersections, (F2) longest dendrite length and (F3) axon arbor area analysis for ZebrinII– (gray) and ZebrinII+ axon arbors (purple) at P10, P14, and P21. Error bars represent SEM., for values see Supplementary file 1. * denotes p<0.05, **p<0.001, and ***p<0.0001. Scale bars = (A) 500 µm in large panels; 20 µm in top inset, 50 µm in bottom inset. (B) 20 µm.


