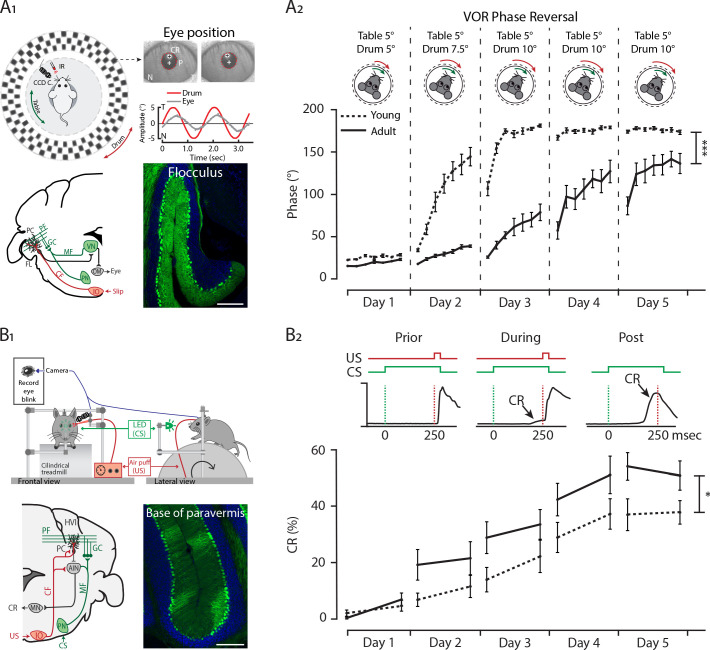
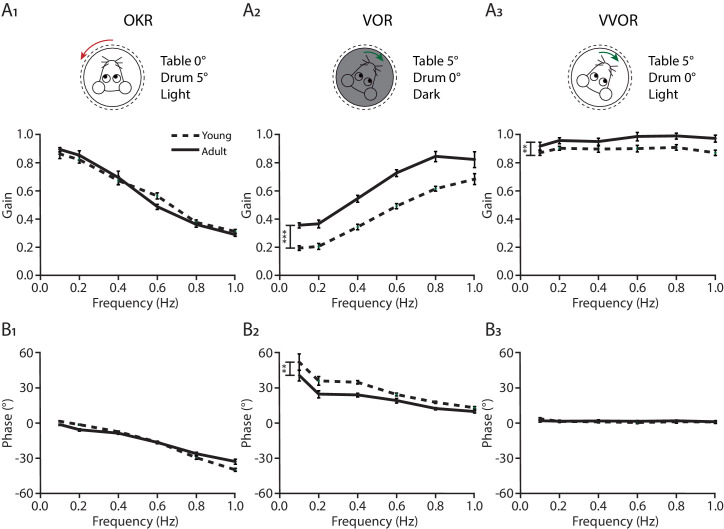
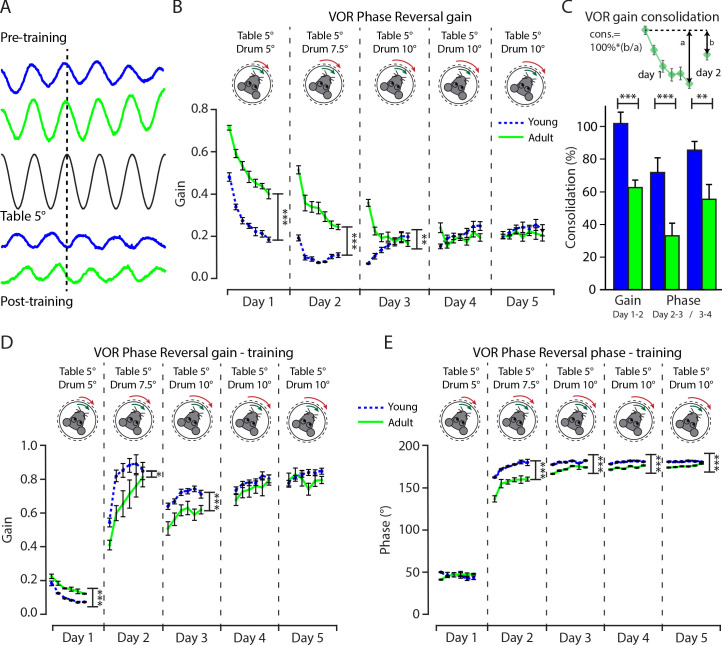
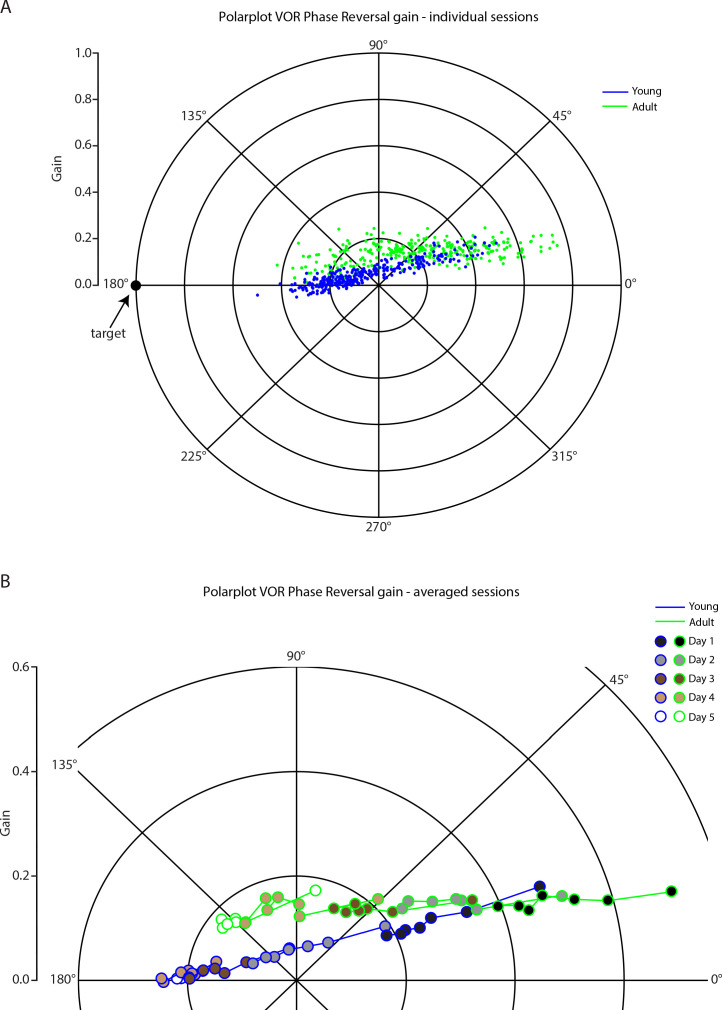
Figure 6. Differential development of cerebellar regions impacts the maturation of cerebellar-specific behaviors.
(A1) Schematic illustration of eye movement recording setup. Mice are head-fixed in the center of a turntable (green arrow) for vestibular stimulation and surrounded by a random dotted pattern drum (red arrow) for visual stimulation. A CCD camera was used for infrared (IR) video-tracking of the left eye (top left). Examples of nasal (N) and temporal (T) eye positions. Red circles = pupil fit; black cross = corneal reflection (CR); white cross = pupil (P) center. Example trace of eye position (gray) with drum position (red), during stimulation at an amplitude of 5° and frequency of 0.6 Hz (top right). Cerebellar circuitry controlling compensatory eye movements and their adaptation. Purkinje cells in the flocculus (FL) receive vestibular and visual input via the mossy fiber (MF) - parallel fiber (PF) system (green) and climbing fiber which influence eye movements via the vestibular nuclei (VN) and the oculomotor (OM) neurons. PN, pontine nuclei; GC, granule cell (bottom left). Photomicrograph of the flocculus a ZebrinII+ Purkinje cell predominant region; Purkinje cells labeled with Aldolase C (green) (bottom right). (A2) Results of 5 days of vestibule-ocular reflex (VOR) phase reversal training, probed by recording VOR (in the dark before, between and after sessions) with mice kept in the dark in between experimental sessions in young (P21-25, dotted line) and adult (P70-90, full line) mice. (B1) Schematic illustration of the eyeblink conditioning setup. Head-fixed mice on a freely moving treadmill, are presented a green LED light (conditioned stimulus, CS) followed several hundred milliseconds later by a weak air-puff on the eye (unconditioned stimulus, US). Eyelid movements were recorded with a camera (top). Cerebellar circuitry controlling eyeblink conditioning. Purkinje cells in the paravermal region around the primary fissure receive inputs carrying sensory information from for example the pontine nuclei (PN) through the mossy fiber-parallel fiber (MF-PF) pathway and the error signal from the inferior olive (IO) through the climbing fiber (CF). These Purkinje cells in turn influence eyelid muscles via the anterior interposed nucleus (AIN) and motor nuclei (MN) (bottom left). Photomicrograph of the base of paravermis a ZebrinII– Purkinje cell predominant region; Purkinje cells labeled with Aldolase C (green) (bottom right). (B2) As a result of repeated conditioned stimulus (CS)-unconditioned stimulus (US) pairings, mice will eventually learn to close their eye in response to the conditioned stimulus (CS), which is called the conditioned response (CR) (top). Percentage of conditioned response (CR%) in young (dotted line) and adult (full line) mice during 5 days of training (bottom). Error bars represent SEM., for values see Supplementary file 1. * denotes p<0.05, **p<0.001, and ***p<0.0001. Scale bars = (A) 200 µm.

