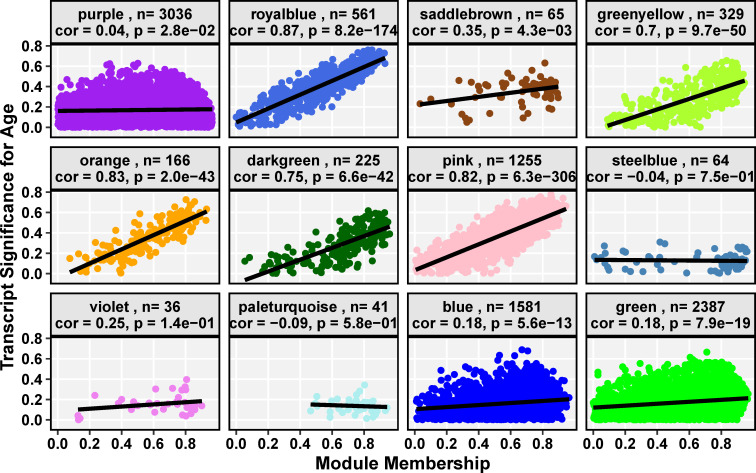
Fig 3. Trait significance–module membership correlation (TS-MM) for each co-expression module of Aplysia californica sensory neurons over the adult lifespan.
The x-axis of each cell is the Pearson correlation of the expression of a transcript and the module eigengene. The y-axis of each cell is the Pearson correlation of the expression of a transcript and chronological age in months. Each module transcript is plotted as a colored point, while the line of best fit, which represents the TS-MM, is rendered in black. Header strips detail the module name, the number of transcripts in that module (n), the TS-MM Pearson correlation value, and the p-value significance of that correlation for each module as calculated by the WGCNA R package. The darkgreen, greenyellow, orange, pink, and royalblue modules have a significant TS-MM ≥ 0.7.

