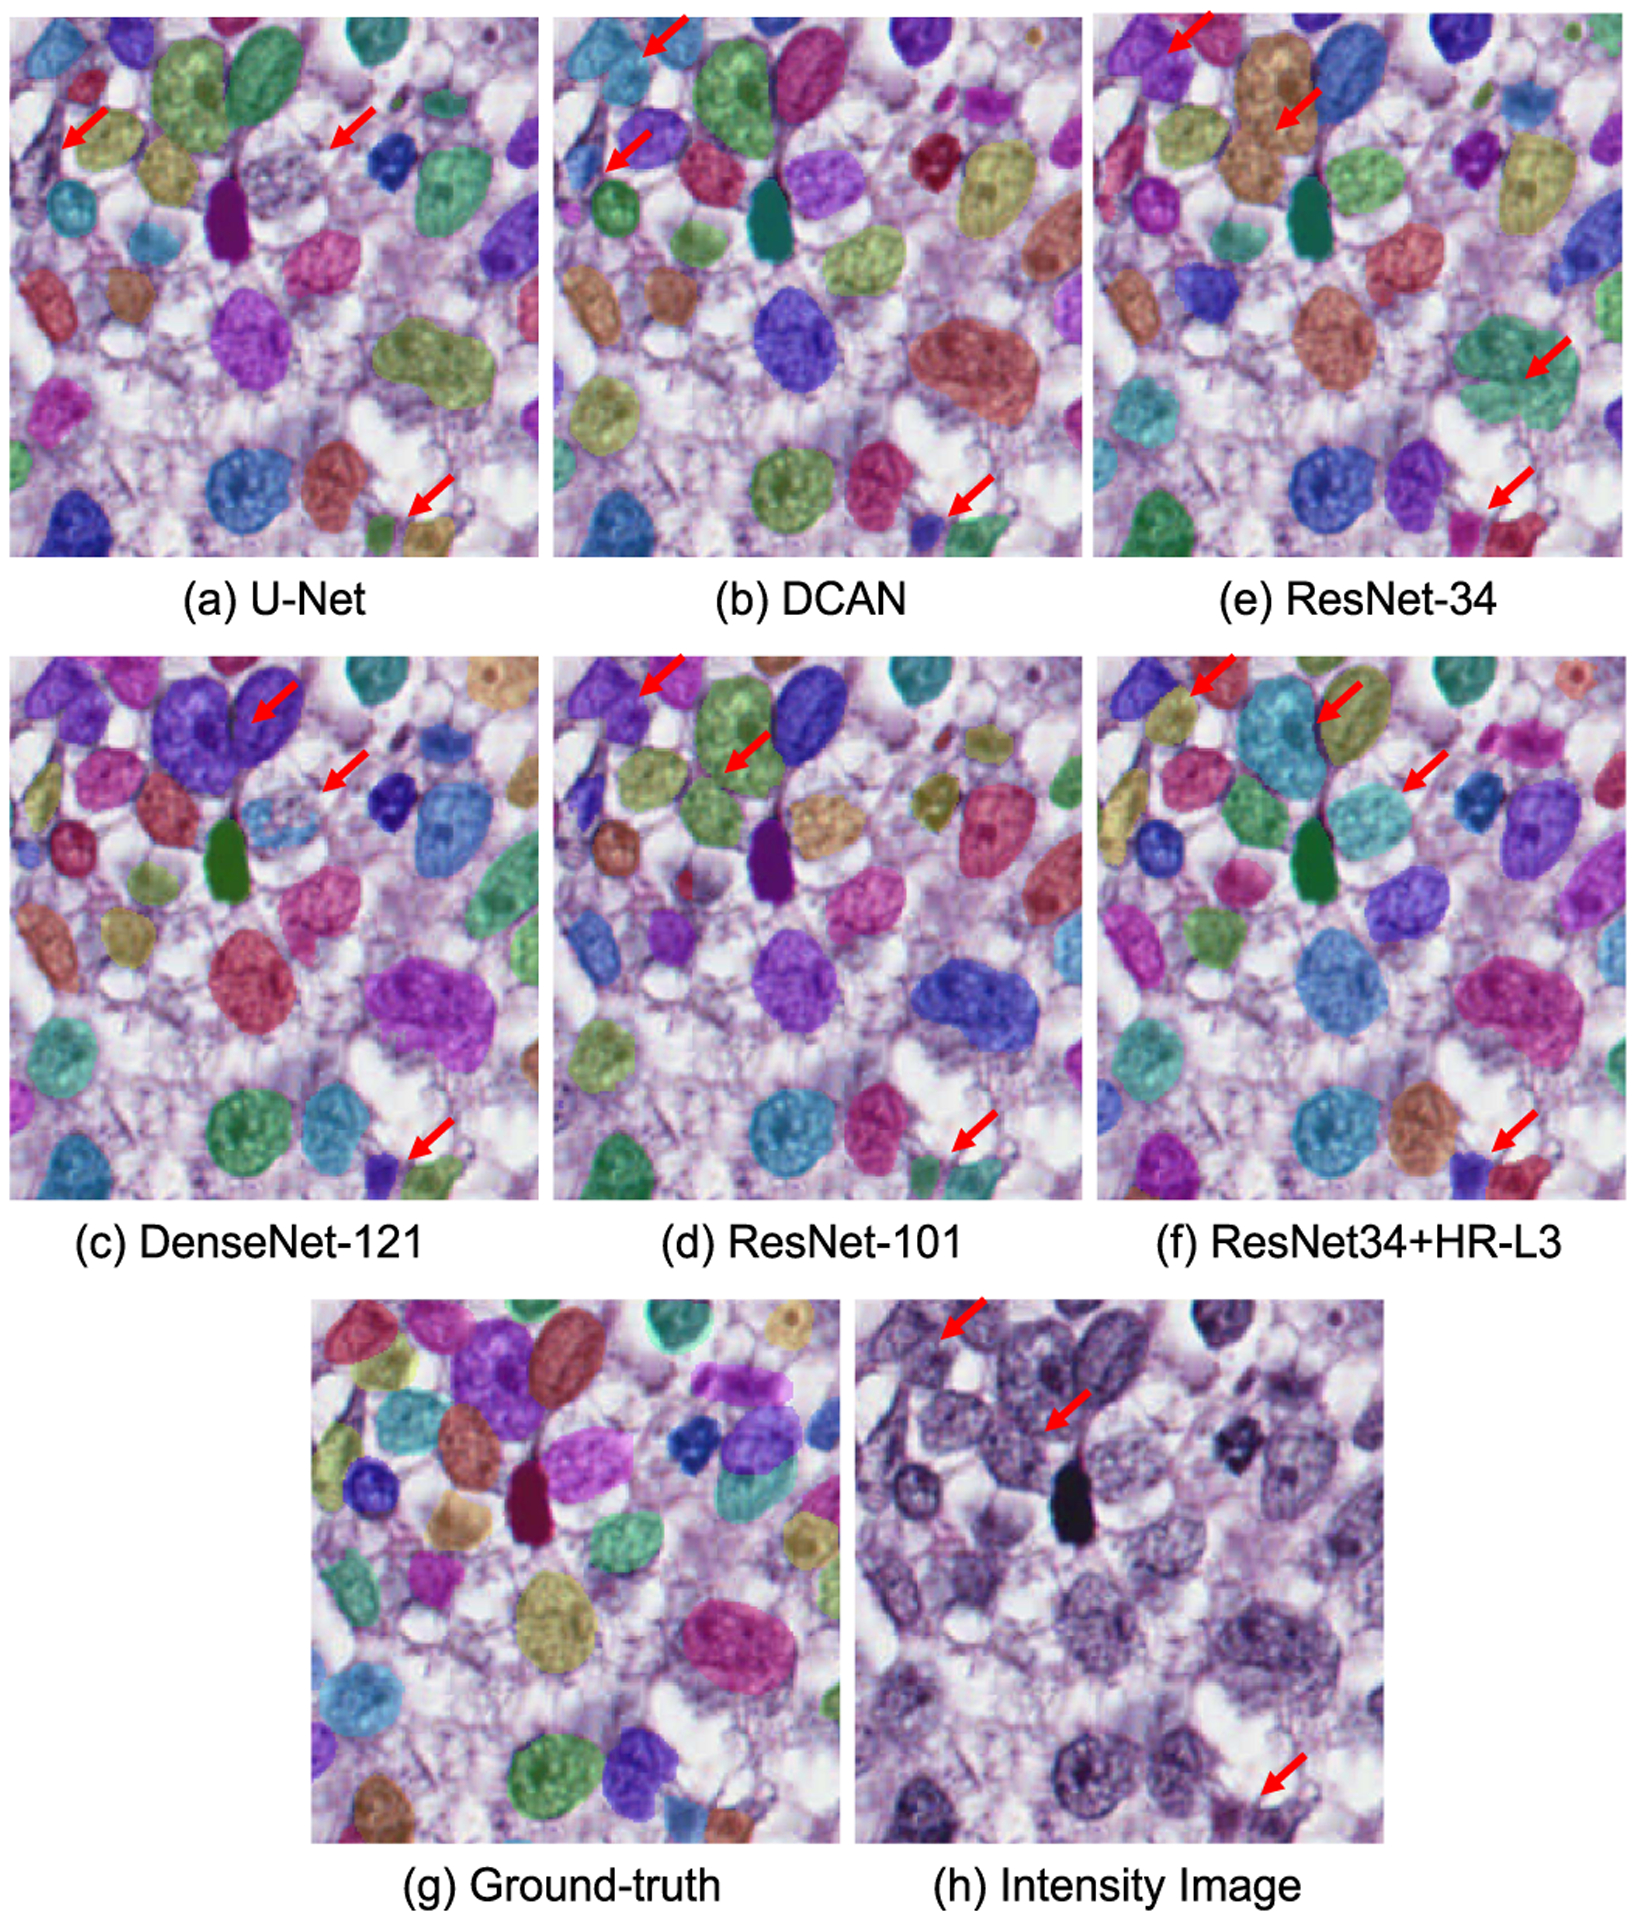
Fig. 11.

Segmentation results illustration on the nuclei segmentation dataset. In these figures, masks of different colors are corresponding to the segmented nuclei. The red arrows in the figures indicate representative segmentation results and the corresponding intensity map.
