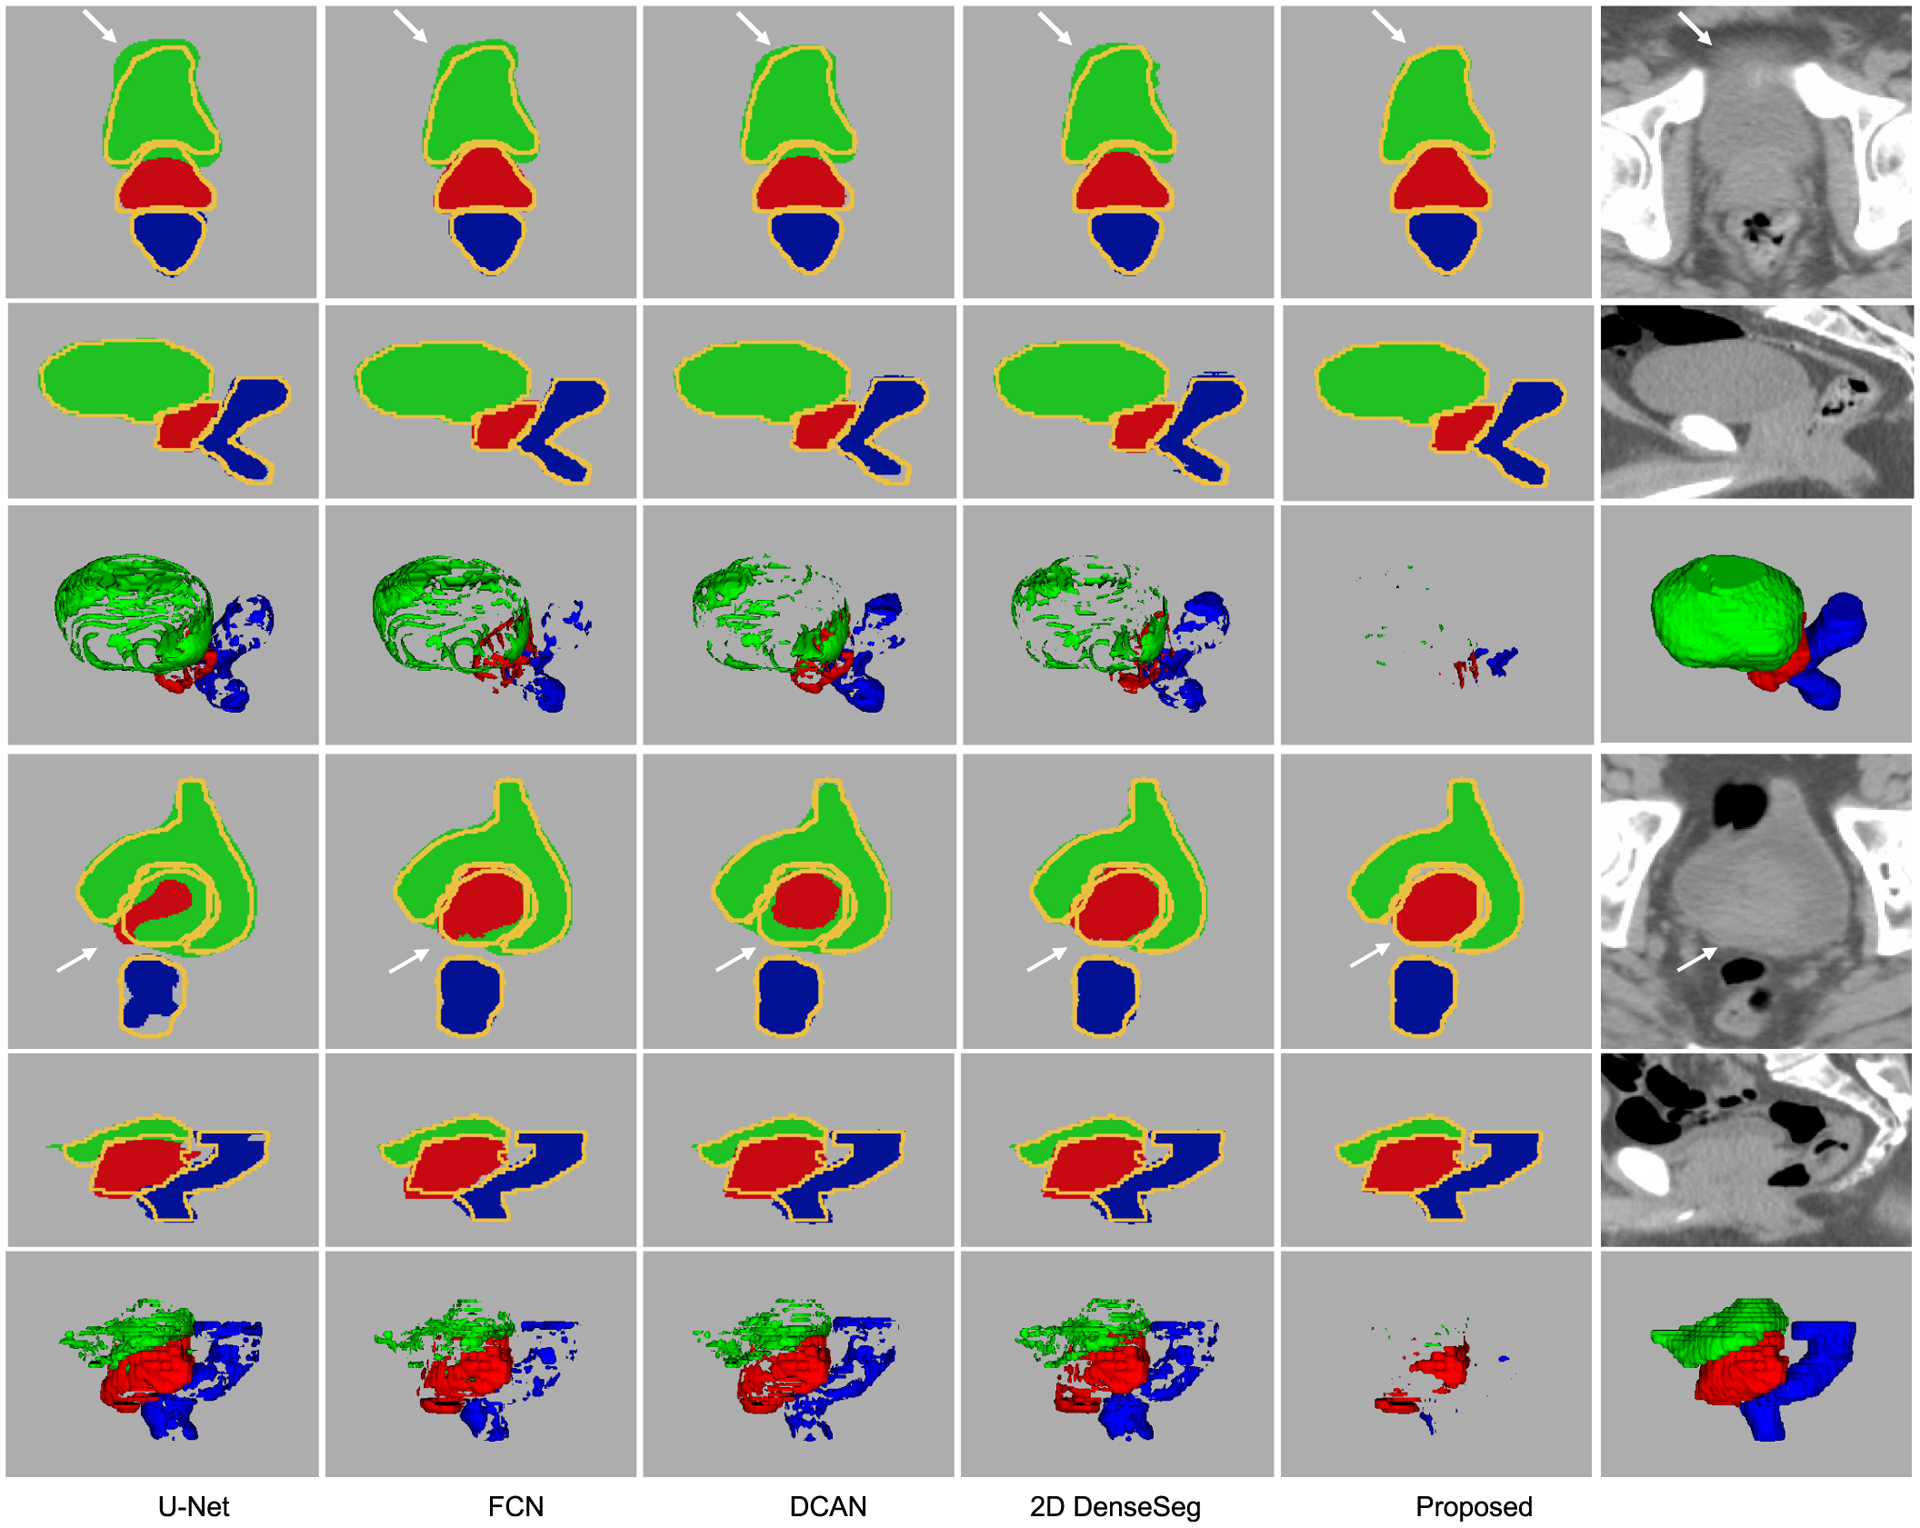
Fig. 8.

Representative segmentation results of the compared state-of-the-art algorithms on the pelvic CT image dataset. In the first and the fourth rows, the segmentation masks and intensity images in the axial direction are provided. In the second and the fifth rows, the results in the coronal direction are provided. The yellow curves in the segmentation masks indicate the ground-truth contours of the target organs. The third and the sixth rows are the difference map and the segmentation ground-truth in 3D space. The green, red, and blue fragments are the false predictions on prostate, bladder, and rectum, respectively.
