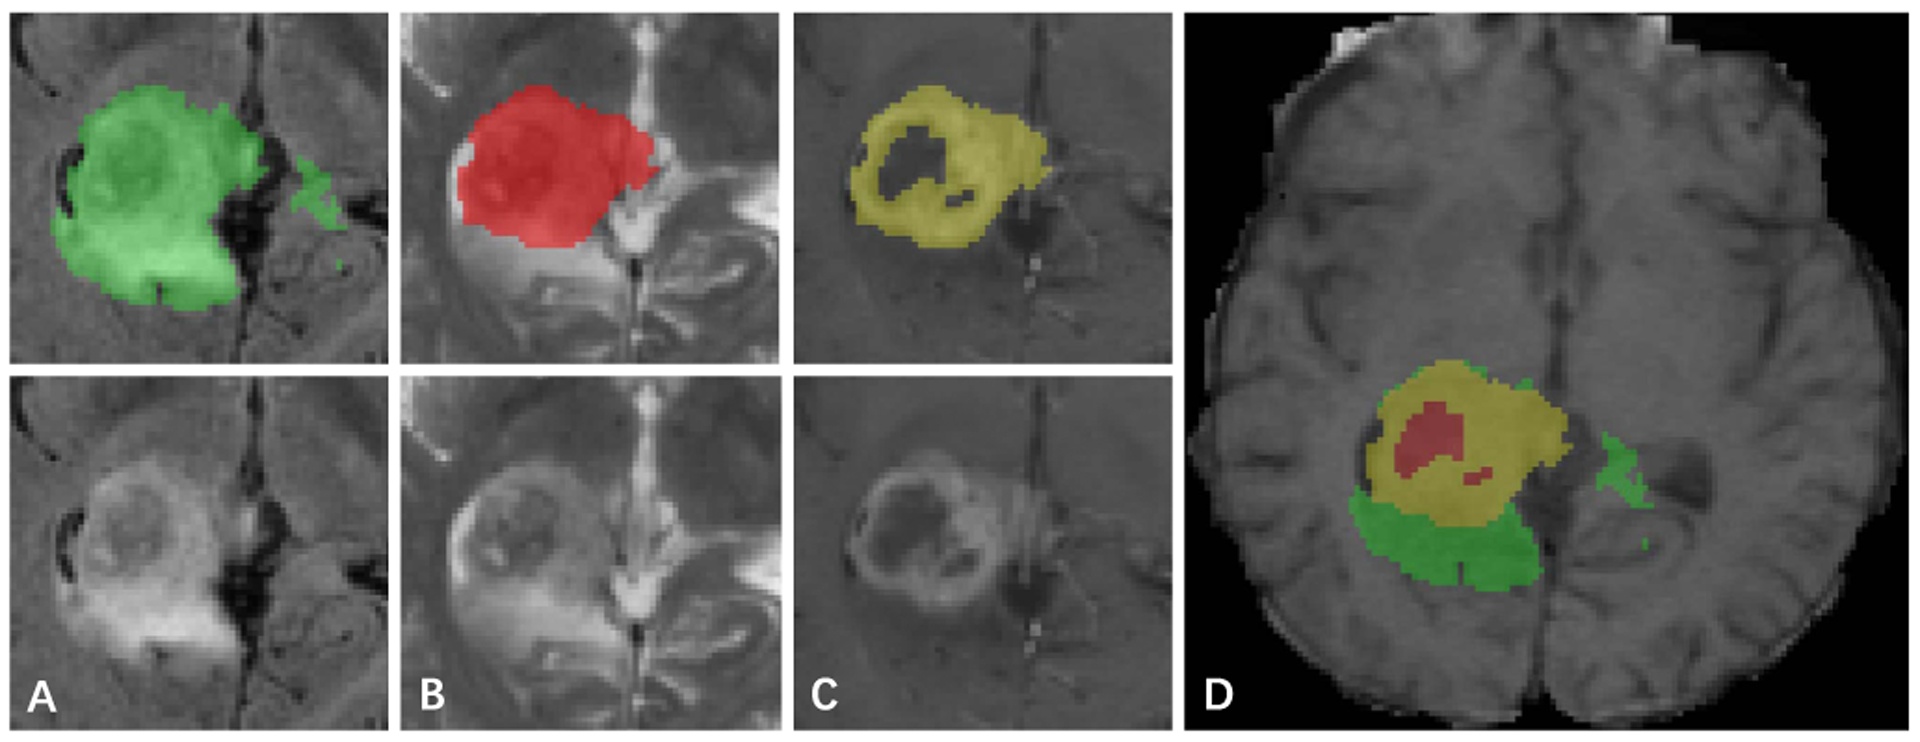
Fig. 9.

Label and intensity image patches of the brain tumor dataset. The visualized image patches (from left to right) are: (A) the whole tumor in FLAIR, (B) the tumor core in T2, (C) the enhancing tumor structures in T1c, (D) the final labels of the tumor structures (the combination of all segmentations) in T1: edema (green), non-enhancing solid core (red), enhancing core (yellow).
