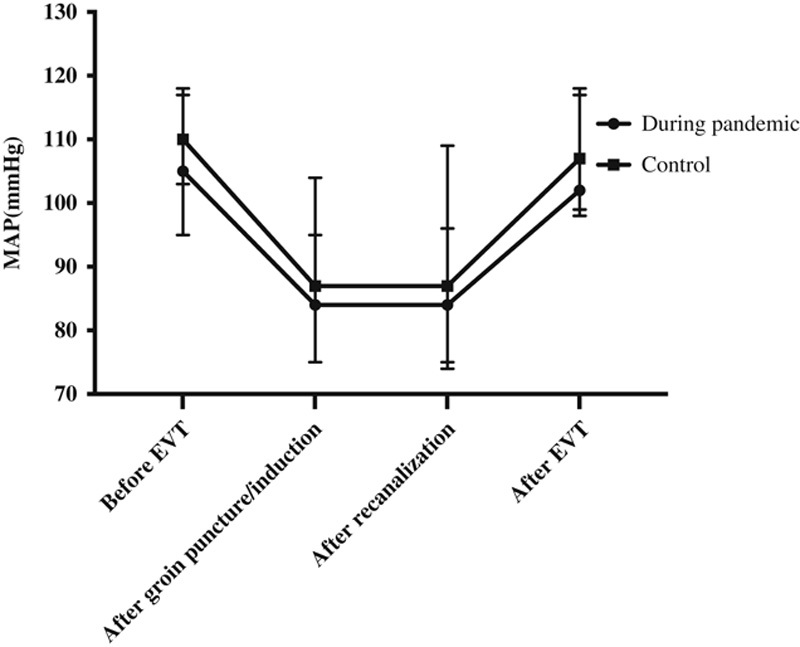
FIGURE 1.

Intraoperative hemodynamics in the 2 groups. During the pandemic (2020), MAP before EVT, after groin puncture/induction, after recanalization and after EVT were 105 (95 to 117) mm Hg, 84 (75 to 104) mm Hg, 84 (75 to 109) mm Hg, and 102 (99 to 118) mm Hg, respectively. In the previous year (2019), MAP before EVT, after groin puncture/induction, after recanalization and after EVT were 110 (103 to 118) mm Hg, 87 (75 to 95) mm Hg, 87 (74 to 96) mm Hg and 107 (98 to 117) mm Hg, respectively. Data are expressed as median and interquartile range. EVT indicates endovascular treatment; MAP, mean arterial pressure.
