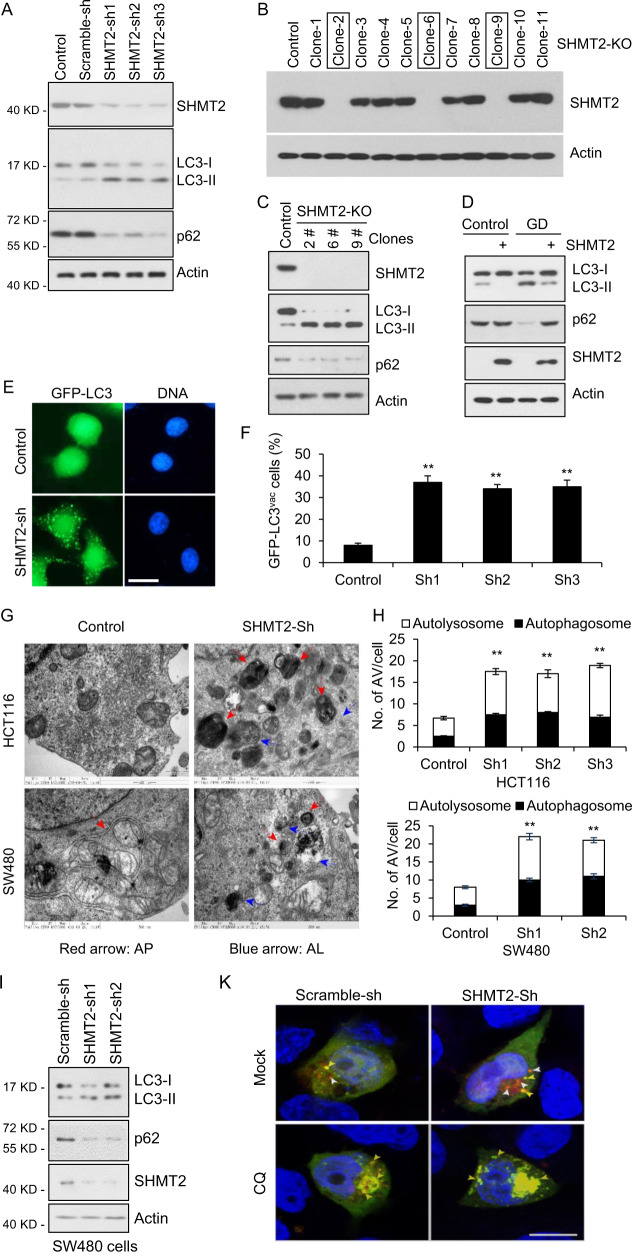
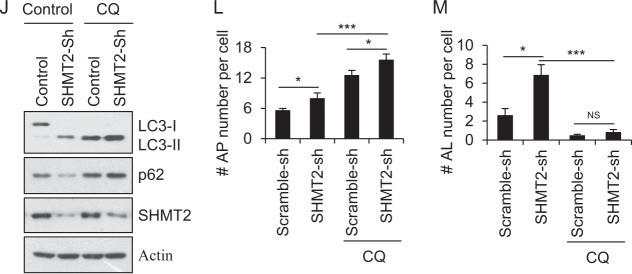
Fig. 2. Depletion of SHMT2 induces autophagy.
A The effect of SHMT2 on autophagy. To establish stable cell lines, HCT116 cells were infected with Scramble-sh (Control) or SHMT2 knockdown (SHMT2-sh-1, -sh-2, or -sh-3) lentivirus for 72 h and selected with puromycin (1 mg/ml). The protein levels of endogenous SHMT2, p62, LC3, and β-actin (as the internal standard) were examined by western blotting. B Identification of SHMT2-KO monoclonal HCT116 cell lines. C The protein levels of endogenous SHMT2, p62, LC3, and β-actin were evaluated in control and SHMT2-KO HCT116 cells. D The effect of SHMT2 on autophagy under glucose deprivation (GD) was assessed. E GFP-LC3 puncta were induced in SHMT2 knockdown cells. Control and SHMT2-sh stable HCT116 cell lines were transfected with the GFP-LC3 plasmid and cultured in complete medium for 24 h. Scale bar, 10 μm. F The percentage of cells exhibiting accumulation of GFP-LC3 in puncta (GFP-LC3vac) is shown (mean ± s.d., n = 3; **P < 0.01). G Ultrastructural evidence of autophagic vacuolization induced by SHMT2 depletion. H The numbers of autophagosomes (APs) and autolysosomes (ALs) were determined in at least 50 cells in three independent experiments (mean ± s.d.; **P < 0.01). I Effect of SHMT2 on LC3 maturation in SW480 cells. To establish stable cell lines, SW480 cells were infected with Scramble-sh (Control) or SHMT2 knockdown (SHMT2-sh-1 or -sh-2) lentivirus for 72 h and selected with puromycin (1 mg/ml). The protein levels of endogenous SHMT2, p62, LC3, and β-actin (as the internal standard) were examined by western blotting. J Autophagy levels were increased in SHMT2-sh cells and prevented by the autophagy inhibitor chloroquine (CQ). K–M Representative images and quantification of HCT116 cells expressing mCherry-GFP-LC3B and the indicated shRNA. APs and ALs were identified as yellow and red puncta, respectively. The numbers of puncta are shown as the mean ± s.e.m. values. Statistical significance was determined by Poisson regression. ns nonsignificant, *P < 0.05, ***P < 0.001.


