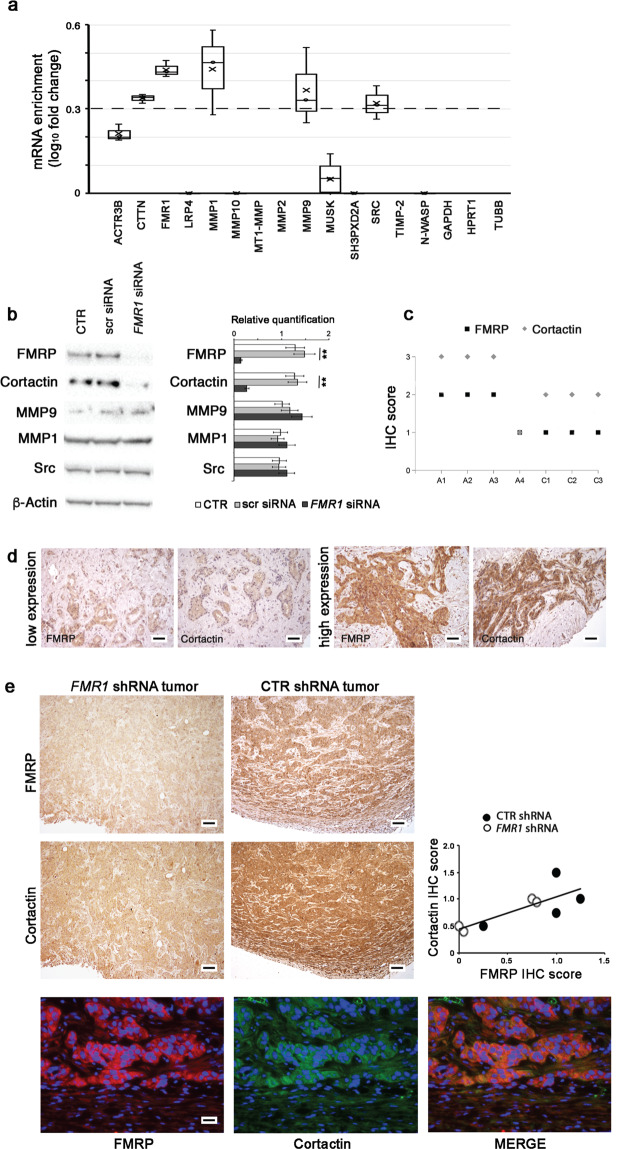
Fig. 7. FMRP binds cortactin mRNA and regulates its expression.
a Cytoplasmic extracts of HuH28 cells were used for immunoprecipitation experiments using the specific anti-FMRP antibody ab17722 (IP FMRP) or nonspecific IgG antibodies (IP IgG). The co-immunoprecipitated RNAs were extracted from each IP and ACTR3B, CTTN, FMR1, LRP4, MMP1, MMP10, MT1-MMP, MMP2, MMP9, MUSK, SH3PXD2A, SRC, TIMP-2, N-WASP, GAPDH, HPRT1, and TUBB mRNAs were quantified by NanoString nCounter® approach. The enrichment of these mRNAs (expressed as log10 fold change) in FMRP IP versus IgG IP is reported in the boxplot, where only the positive values are shown. N = 3. Dashed line represents the confidence threshold chosen for log10 fold change that correspond to a fold change = 2. b HuH28 cells were untransfected (CTR) or transfected with three specific FMR1 siRNAs (FMR1 siRNA) or with a scrambled nonspecific siRNA (scr siRNA) and incubated for 72 h. Representative images of a western blot probed with anti-FMRP, anti-Cortactin, anti-MMP9, anti-MMP1, anti Src, and anti-β-Actin antibodies from protein extracts of the three cellular conditions (left panel). In right panel, a quantitation of FMRP, Cortactin, MMP9, MMP1, and Src expressions, compared to β-Actin expression, is shown. Columns, mean; bars, SE. **p < 0.01 compared to CTR or scr siRNA (Student’s t test). c IHC data were obtained by The Human Protein Atlas library. Four iCCA samples (A1–A4) and three healthy livers (C1–C3) were evaluated for both Cortactin and FMRP expression and scored from +0 to +3. d Cortactin expression was evaluated by IHC in three human iCCAs with low FMRP expression and three human iCCAs with high FMRP expression. Representative images of FMRP and Cortactin immunostaining in a FMRP low expression sample (left panels) and a FMRP high expression sample (right panels) were shown. Scale bars: 150 μm. e Representative images of FMRP and Cortactin IHCs in xenograft tumors from FMR1 shRNA (left panels) or CTR shRNA (right panels) transfected HuCCT cells. Original magnification 10×; scale bars: 250 μm. FMRP and Cortactin IHC expression in FMR1 shRNA and CTR shRNA xenograft tumors are highly correlated (right panel); E, ρ = 0.34, *p < 0.05 with Spearman’s correlation Test. Double-IF labeling experiments show most cells co-expressing FMRP and Cortactin proteins (lower panels). FMRP was stained in red, Cortactin in green and nuclei in DAPI (blue). Original magnification 40×; scale bars: 60 μm.

