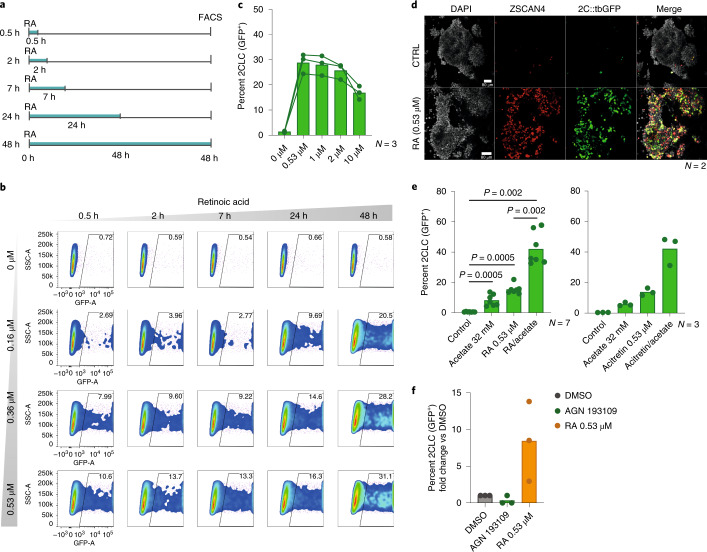
Fig. 1. Low concentrations of RA robustly induce 2CLCs.
a, Experimental design. Embryonic stem (ES) cells were treated with a range of RA concentrations for different time periods. 2CLC induction was measured by FACS, 48 h after treatment. b, Representative scatter plot for the experiment in a, showing 2C::tbGFP fluorescence measurements of individual cells as assayed by FACS. c, Effect of high RA concentrations on 2CLCs induction. The percentage of 2CLCs (GFP+) quantified by FACS 48 h after treatment is shown (bars show the mean of the indicated number of replicates). Each line and connecting dots correspond to measurements of one replicate. d, Immunofluorescence using antibodies for the indicated proteins. The merge images show 4′,6-diamidino-2-phenylindole (DAPI; gray), ZSCAN4 (red) and tbGFP (green) expression. Scale bars, 80 µm. e, Effect of treatment with retinoids in combination with acetate on 2CLC induction. The percentage of 2CLCs (GFP+) was quantified by FACS, 48 h after treatment. The mean of the indicated replicates (represented by individual dots) is shown. P values were calculated by two-sided Mann–Whitney test. f, Induction of 2CLCs from ZSCAN4+ cells upon RA treatment. The percentage of 2CLCs (GFP+/mCherry+) was quantified by FACS, 24 h after sorting ZSCAN4+ (GFP−/mCherry+) cells.

