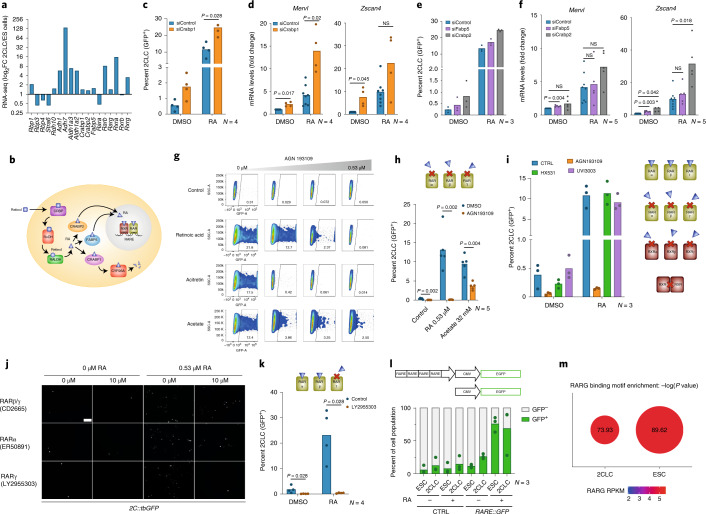
Fig. 2. RARγ is required for 2CLC emergence.
a, Expression levels (log2FC) (FC, fold change) of selected RA-pathway-related genes in 2CLCs and ES cells (ESCs) based on RNA-seq data (N = 2, from ref. 16). b, Schematic of the RA pathway. c, Induction of 2CLCs upon siRNA for Crabp1 and RA treatment. The percentage of 2CLCs was quantified by FACS. The mean ± s.d. of the indicated number of replicates is shown. P values were calculated by two-sided Mann–Whitney test. d, Quantitative polymerase chain reaction (qPCR) analysis upon transfection of siRNA for Crabp1 and RA treatment. Mean ± s.d. values of the indicated number of replicates are shown. P values were calculated by two-sided Student’s t-test. NS, not significant. e, Induction of 2CLCs upon transfection of siRNA for Fabp5 and Crabp2 and RA treatment. The percentage of 2CLCs was quantified by FACS. The mean ± s.d. of the indicated number of replicates is shown. f, qPCR analysis after transfection of siRNA for Fabp5 and Crabp2 and RA treatment. Mean ± s.d. values of the indicated number of replicates are shown. P values were calculated by two-sided Student’s t-test. g, Representative scatter plots from data in 3 h showing 2C::tbGFP fluorescence measurements of individual cells as assayed by FACS. h, Induction of 2CLCs upon treatment with AGN193109. The percentage of 2CLCs was quantified by FACS, 48 h after treatment. Mean values of the indicated replicates are shown. P values were calculated by two-sided Mann–Whitney test. i, Induction of 2CLCs upon treatment with RAR and RXR antagonists. The percentage of 2CLCs was quantified by FACS, 48 h after treatment. Mean ± s.d. values of the indicated replicates are shown. j, Representative fluorescence images of ES cell colonies harboring the 2C::tbGFP reporter, 48 h after treatment with the indicated antagonists and RA. Scale bar, 100 µm. k, Induction of 2CLCs upon treatment with LY2955303. The percentage of 2CLCs was quantified by FACS, 48 h after treatment. The mean of the indicated replicates is shown. P values were calculated by two-sided Mann–Whitney test. l, Percentage of 2CLCs displaying RARE activity. The percentage of 2CLCs (tdTOMATO+) and ES cells (tdTOMATO−) with RARE activity (GFP+) was quantified by FACS, 48 h after RARE::EGFP reporter transfection and 24 h after RA treatment. The mean of the indicated replicates is shown. m, RARγ binding motif enrichment in open chromatin regions, using 2CLC and ES cell specific peaks. Dot size: −log10(P value).

