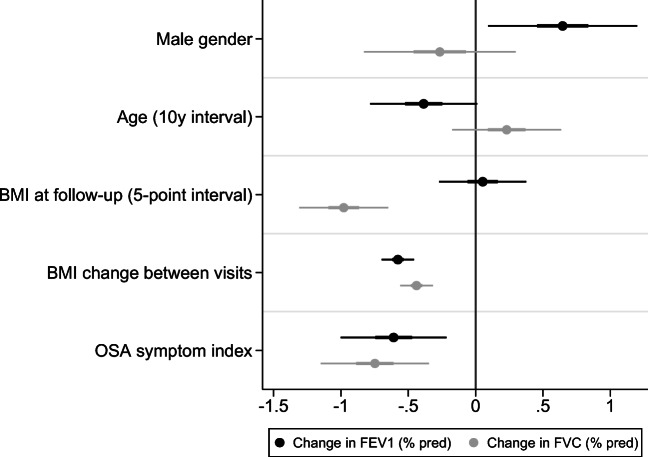
Fig. 1.
Multivariate mixed regression model on change in percent predicted of FEV1 and FVC between visits, showing coefficients with 50% and 95% confidence intervals. Adjusted for pack-years, baseline spirometry value and centre. Note that variables differ in scale (categorical, gender; ordinal, OSA symptom score; continuous, BMI, age), affecting the interpretation of each coefficient. OSA, obstructive sleep apnoea; % pred, percent predicted

