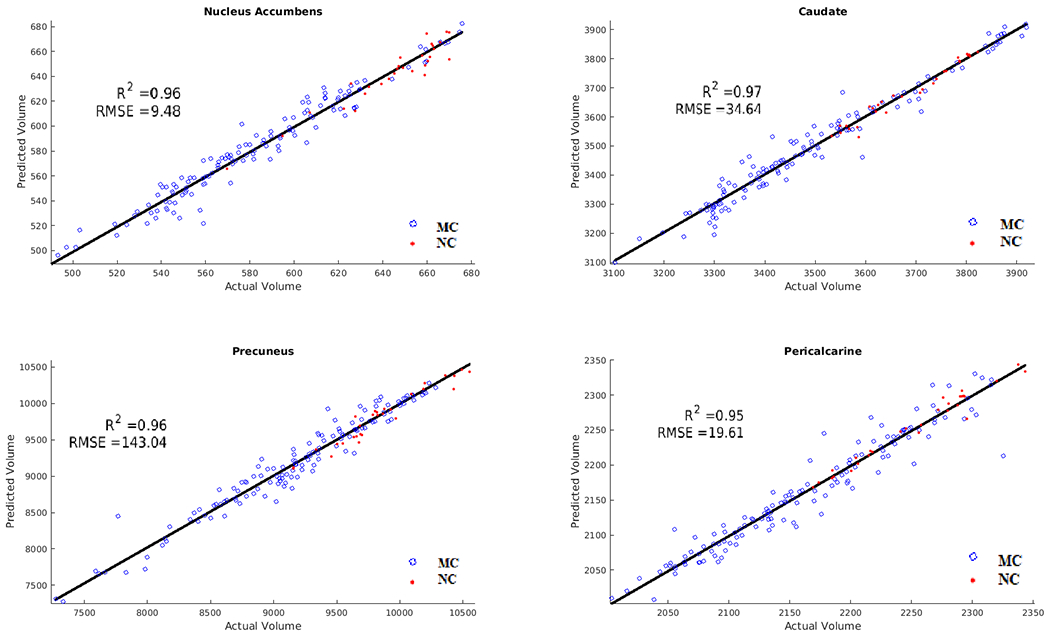
Figure 3.

Results of brain volumetric predictions for mutation carriers (MC) (blue) and non-carriers (NC) (red). Correlation and root mean squared error (RMSE) of predicted versus actual values. The ANN was able to predict changes in brain volumes with an average R2 value of 0.95 and showed a general trend of MCs having more brain atrophy than NCs.
