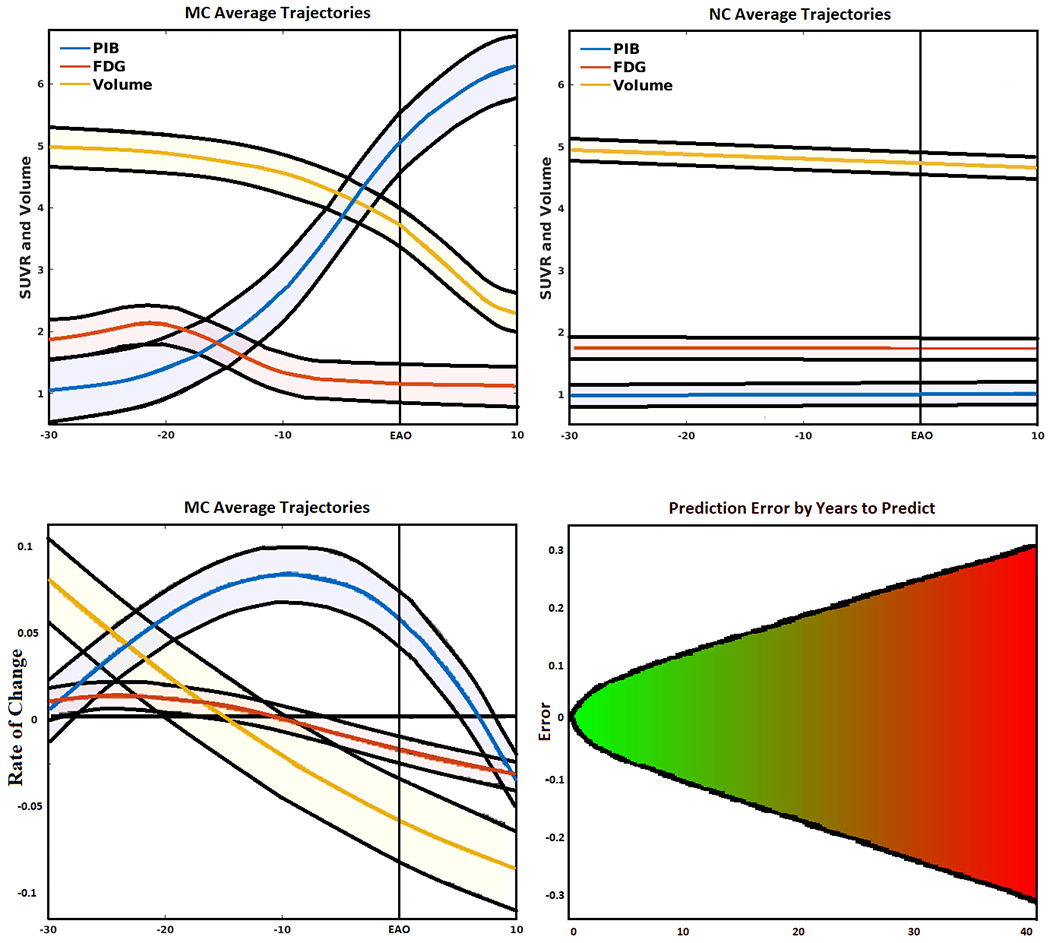
Figure 4.

(Top left) Simulated biomarker evolution for total mean cortical and subcortical Pittsburgh Compound-B (PiB), total mean cortical and subcortical fluorodeoxyglucose (FDG), and total gray matter volume (scaled to a common interval) derived from the artificial neural network (ANN) in mutation carriers (MC). Shaded region indicates model variability, with EAO marked by perpendicular line. (Top right) Simulated biomarker evolution for total mean cortical and subcortical PiB, total mean cortical and subcortical FDG, and total gray matter volume (scaled to a common interval) derived from the ANN in mutation non-carriers (NC). (Bottom left) Normalized biomarker rate of change for mean PiB, mean FDG, and total gray matter volume (scaled to a common interval) fit to a polynomial curve showing 95% confidence interval. (Bottom right) Mean absolute error of predicted (normalized) biomarker values given the amount of time in the future to predict, fit with a 2-degree polynomial curve projected into the future. Errors increased linearly with an increase in the amount of time in the future to predict.
