
FIGURE 1.
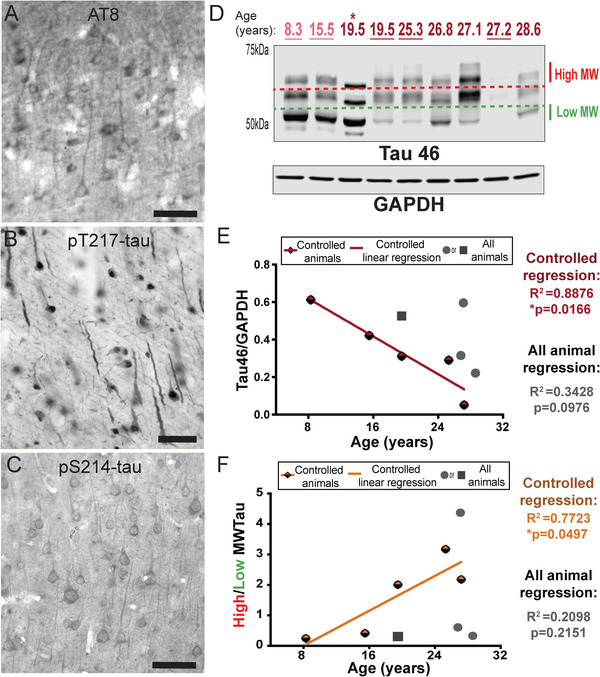
Age‐related alterations in tau phosphorylation and aggregation in monkey dlPFC. (A) Mild tau fibrillation revealed with AT8 labeling was observed in deep LIII pyramidal cells in aged monkey dlPFC (30 years), predominantly along apical dendrites. (B) Dense immunoreactivity for pT217‐tau along apical and basilar dendrites of pyramidal cells in aged monkey dlPFC (30 years) deep LIII. (C) The aged monkey dlPFC (26 years) was characterized by dense pS214‐tau immunoreactivity along apical and basal dendrites of pyramidal cells located in deep LIII, and diffuse reactivity in the neuropil. (D) Macaque dlPFC tissue (15 μg) was immunoblotted for total tau and glyceraldehyde‐3‐phosphate dehydrogenase (GAPDH). The dotted lines represent the regions of the blot quantified for different molecular weight (MW) tau species. Low MW tau species are denoted by the green dashed line and appear at 50 kDa. High MW tau species are denoted by the red dashed line and appear > 60 kDa. Animals are labeled by their age in years: young animals are light red and aged animals are dark red. Controlled set animals are underlined. (E) Quantification of total triton‐soluble tau normalized byGAPDH are plotted by age. Controlled set animals are denoted by half‐red diamonds. First (leftmost) 19.5 animal denoted by asterisk in D is denoted by a square. All other animals are denoted by gray circles. Linear regression is shown for the controlled set animals and labeled red (R2 = 0.8876, *P = 0.0166). Results from an all‐animal linear regression are summarized in the top right of the graph (R2 = 0.3428, P = 0.0976). (F) Quantification of the MW shift of triton‐soluble tau is represented by the ratio of high over low MW tau and plotted by age. Controlled set animals are denoted by half‐orange diamonds. First 19.5 animal denoted by asterisk in D is denoted by a square. All other animals are denoted by gray circles. Linear regression is shown for the controlled set animals and labeled orange (R2 = 0.7723, *P = 0.0497). Results from an all‐animal linear regression are summarized in the top right of the graph (R2 = 0.2098, P = 0.2151)