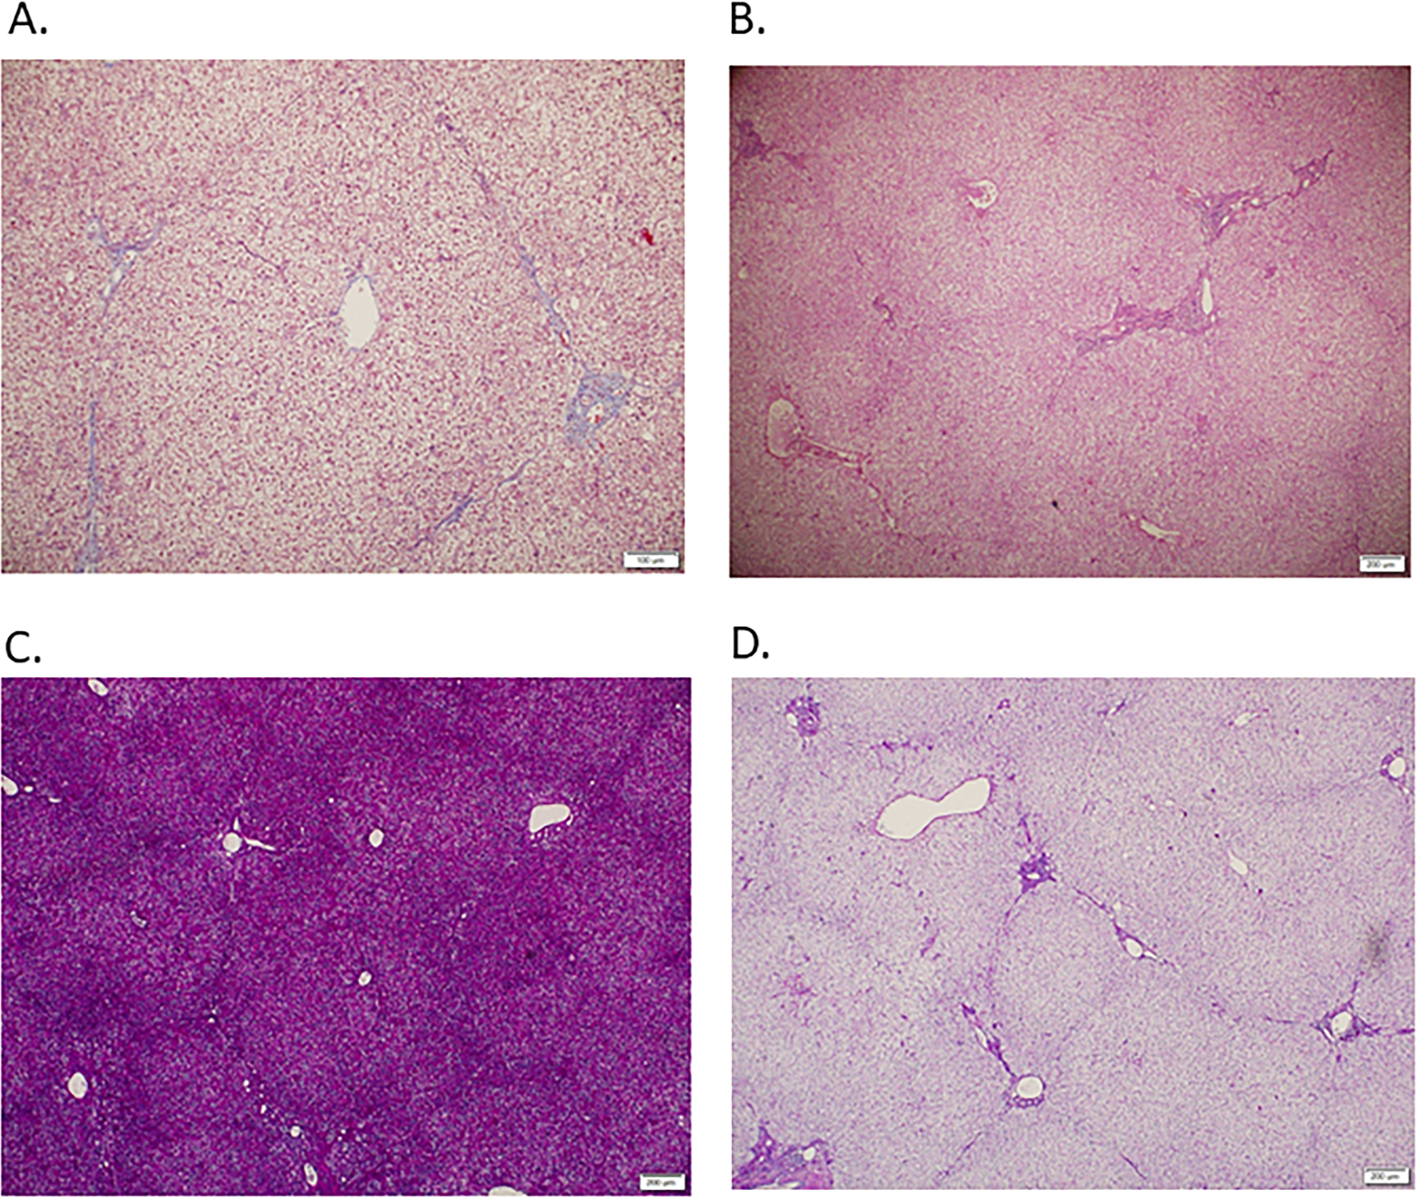
Figure 2. Liver explant tissue from individual with OTC deficiency who had liver transplantation after biomarker evaluations.

A. Trichrome staining (100x) shows stage 1 fibrosis. B. Hematoxylin and eosin staining (40x) shows mild expansion of portal tracts by fibroconnective tissue. C. PAS stain without diastase (40x) demonstrates strong staining suggestive of hepatic glycogen accumulation. D. PAS with diastase (40x) shows markedly reduced intra-hepatic PAS staining which is consistent with hepatic glycogen.
