
Figure 1: Virtual environment and hippocampal local-field potential during task.
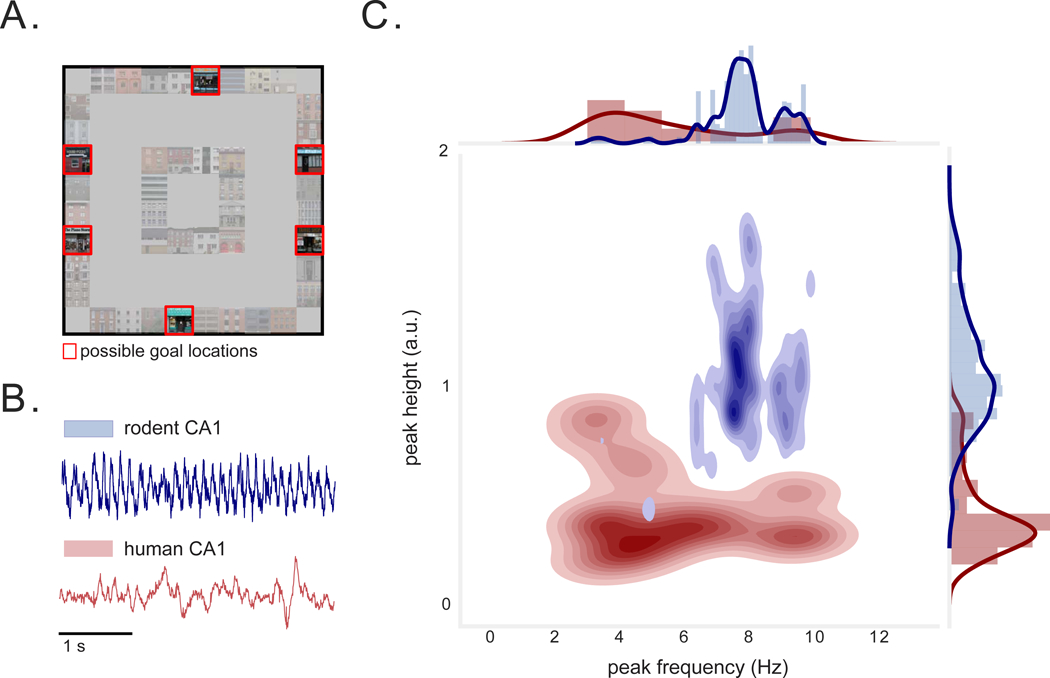
A) Overhead view of task environment. Red squares denote locations of possible goal locations. B) Examples of raw LFP data from rodent (publicly available dataset (Mizuseki et al., 2013)) and human hippocampus. C) Joint distribution depicting the peak frequency and peak height of LFP power spectra (PSD) measured from individual rodent (blue) and human (red) hippocampal electrodes. Different electrodes in the rodent hippocampus exhibit highly stereotyped peaks. Human hippocampal recordings exhibit spectral peaks that are significantly smaller in height, and at significantly lower and broader frequencies (p’s < 4×10⁻⁴). See also Figure S1.