
Figure 1. Transcriptomic cell type taxonomy of the isocortex and hippocampal formation.
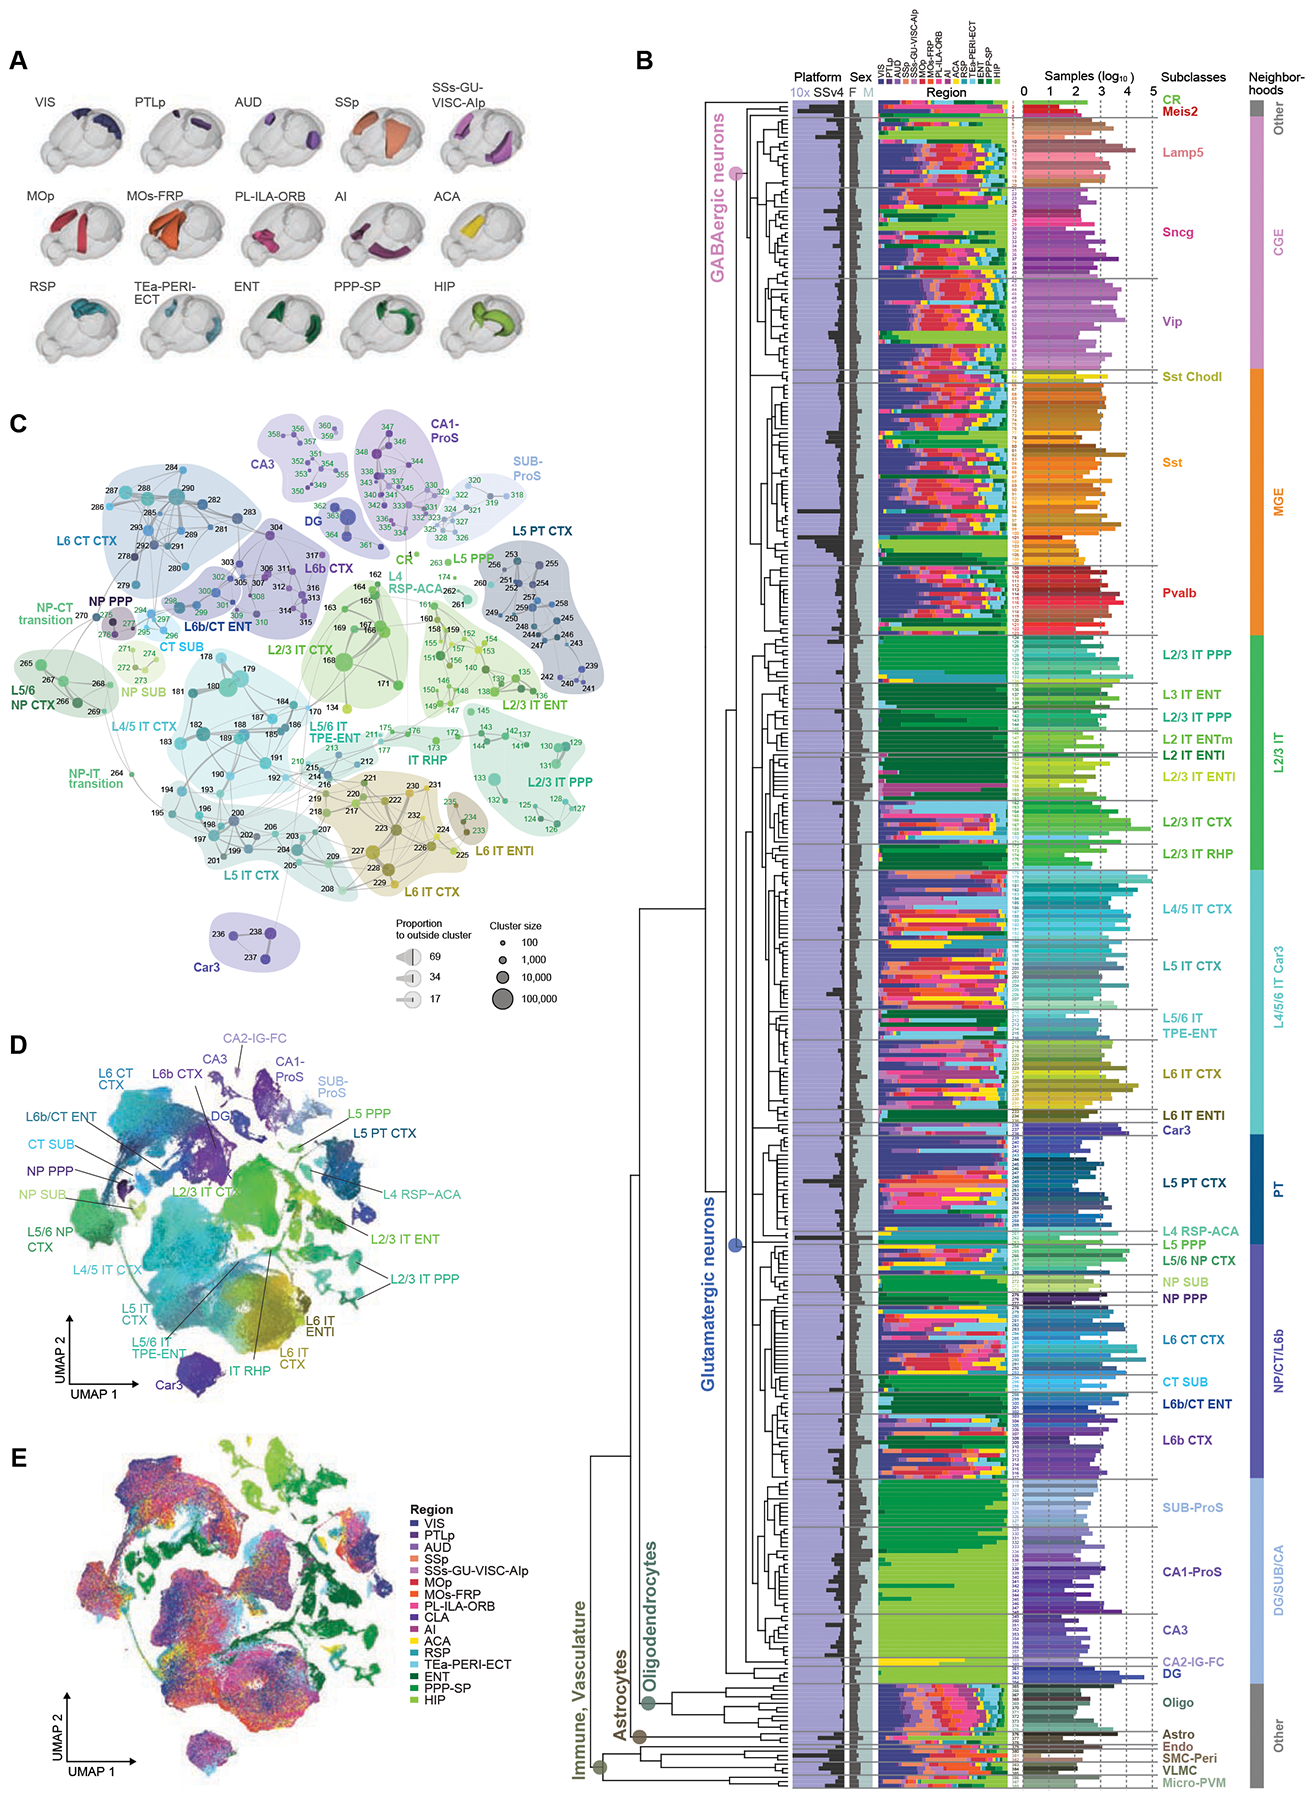
(A) Overview of sampled brain regions rendered in Allen CCFv3. The PPP-SP joint region includes PAR-POST-PRE-SUB-ProS.
(B) The transcriptomic taxonomy tree of 388 clusters organized in a dendrogram (10xv2: n = 1,169,213; SSv4: n = 73,346). Bar plots represent fractions of cells profiled according to platform, sex, and region, and the total number of cells per cluster on a log10 scale.
(C) Constellation plot of the global relatedness between glutamatergic types. Each cluster is represented by a dot, positioned at the cluster centroid in UMAP coordinates shown in D. Clusters are grouped by subclass. Clusters with more than 80% of cells derived from HPF are labeled green.
(D-E) UMAP representation of glutamatergic types colored by cluster (D) or region (E).
See also Tables S1–S4, Methods S1, Data S1, Figure S2.