
Figure 2. GABAergic cell types of isocortex and hippocampal formation.
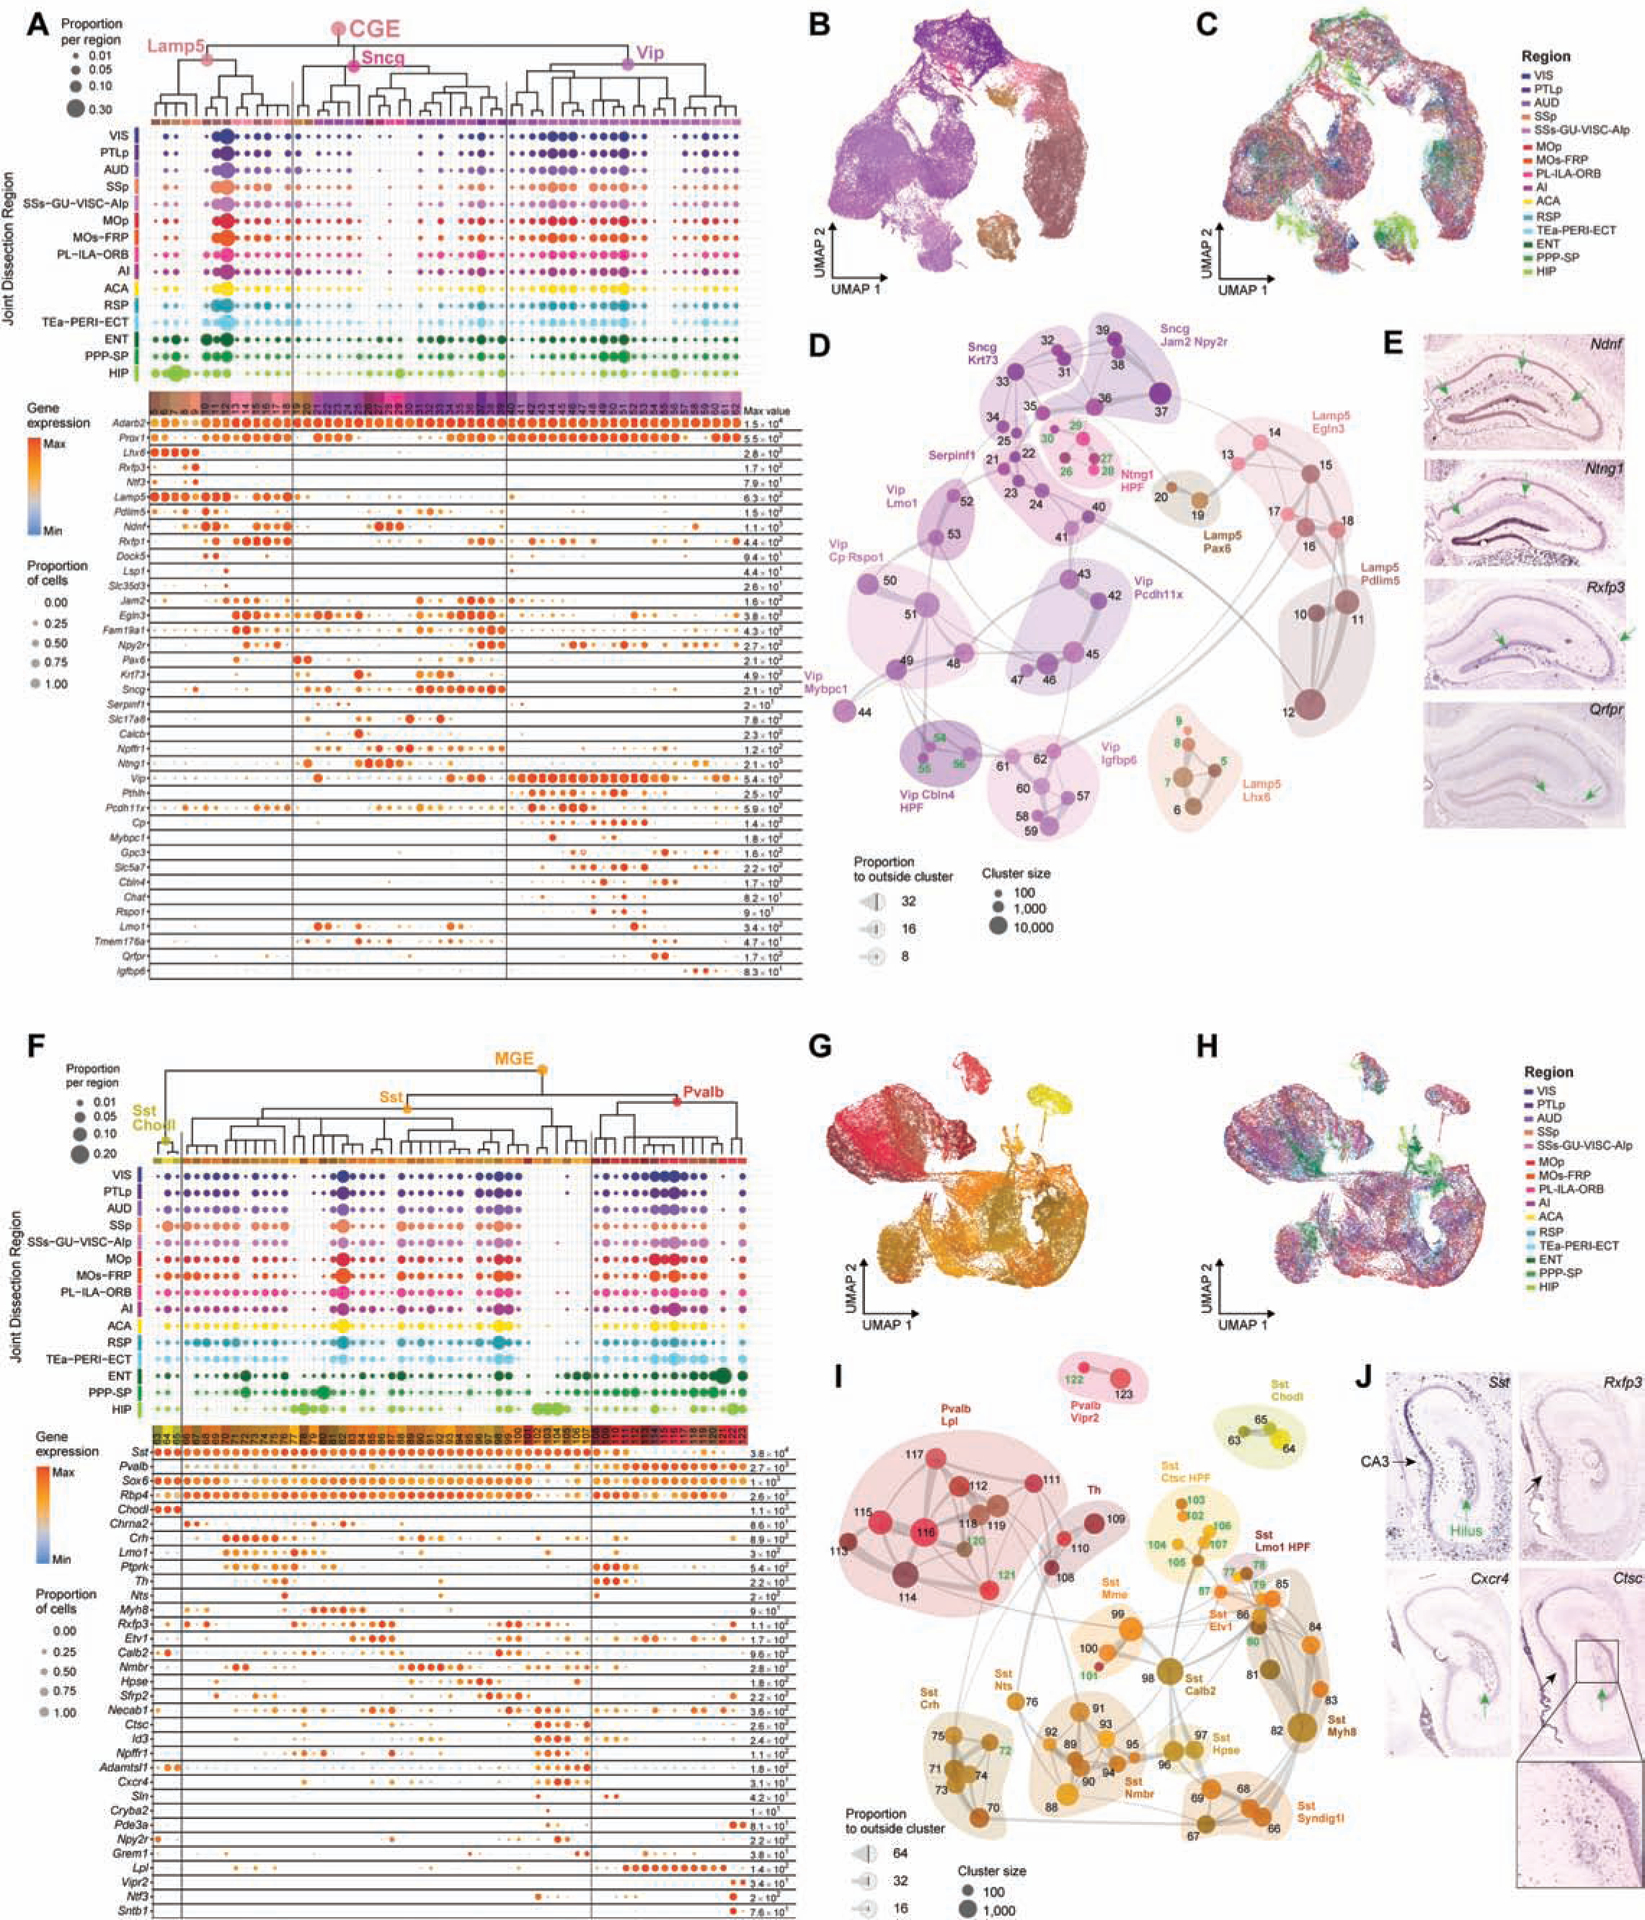
(A) Dendrogram of CGE clusters followed by dot plots showing proportion of cells within each cluster derived from each region of dissection and marker gene expression in each cluster from the 10xv2 dataset. Dot size and color indicate proportion of expressing cells and average expression level in each cluster, respectively.
(B-C) UMAP representation of CGE clusters, colored by cluster (B) or region (C).
(D) Constellation plot of CGE clusters using UMAP coordinates shown in B. Clusters are grouped by supertype. Clusters with more than 80% of cells derived from HPF are labeled green.
(E) RNA ISH from Allen Mouse Brain Atlas (ABA) for select markers expressed in the HPF-specific CGE supertypes.
(F-J) Same as A-E but for MGE clusters.