
Figure 4. Transcriptomic relationship and anatomical distribution of IT-like cell types in retrohippocampal regions.
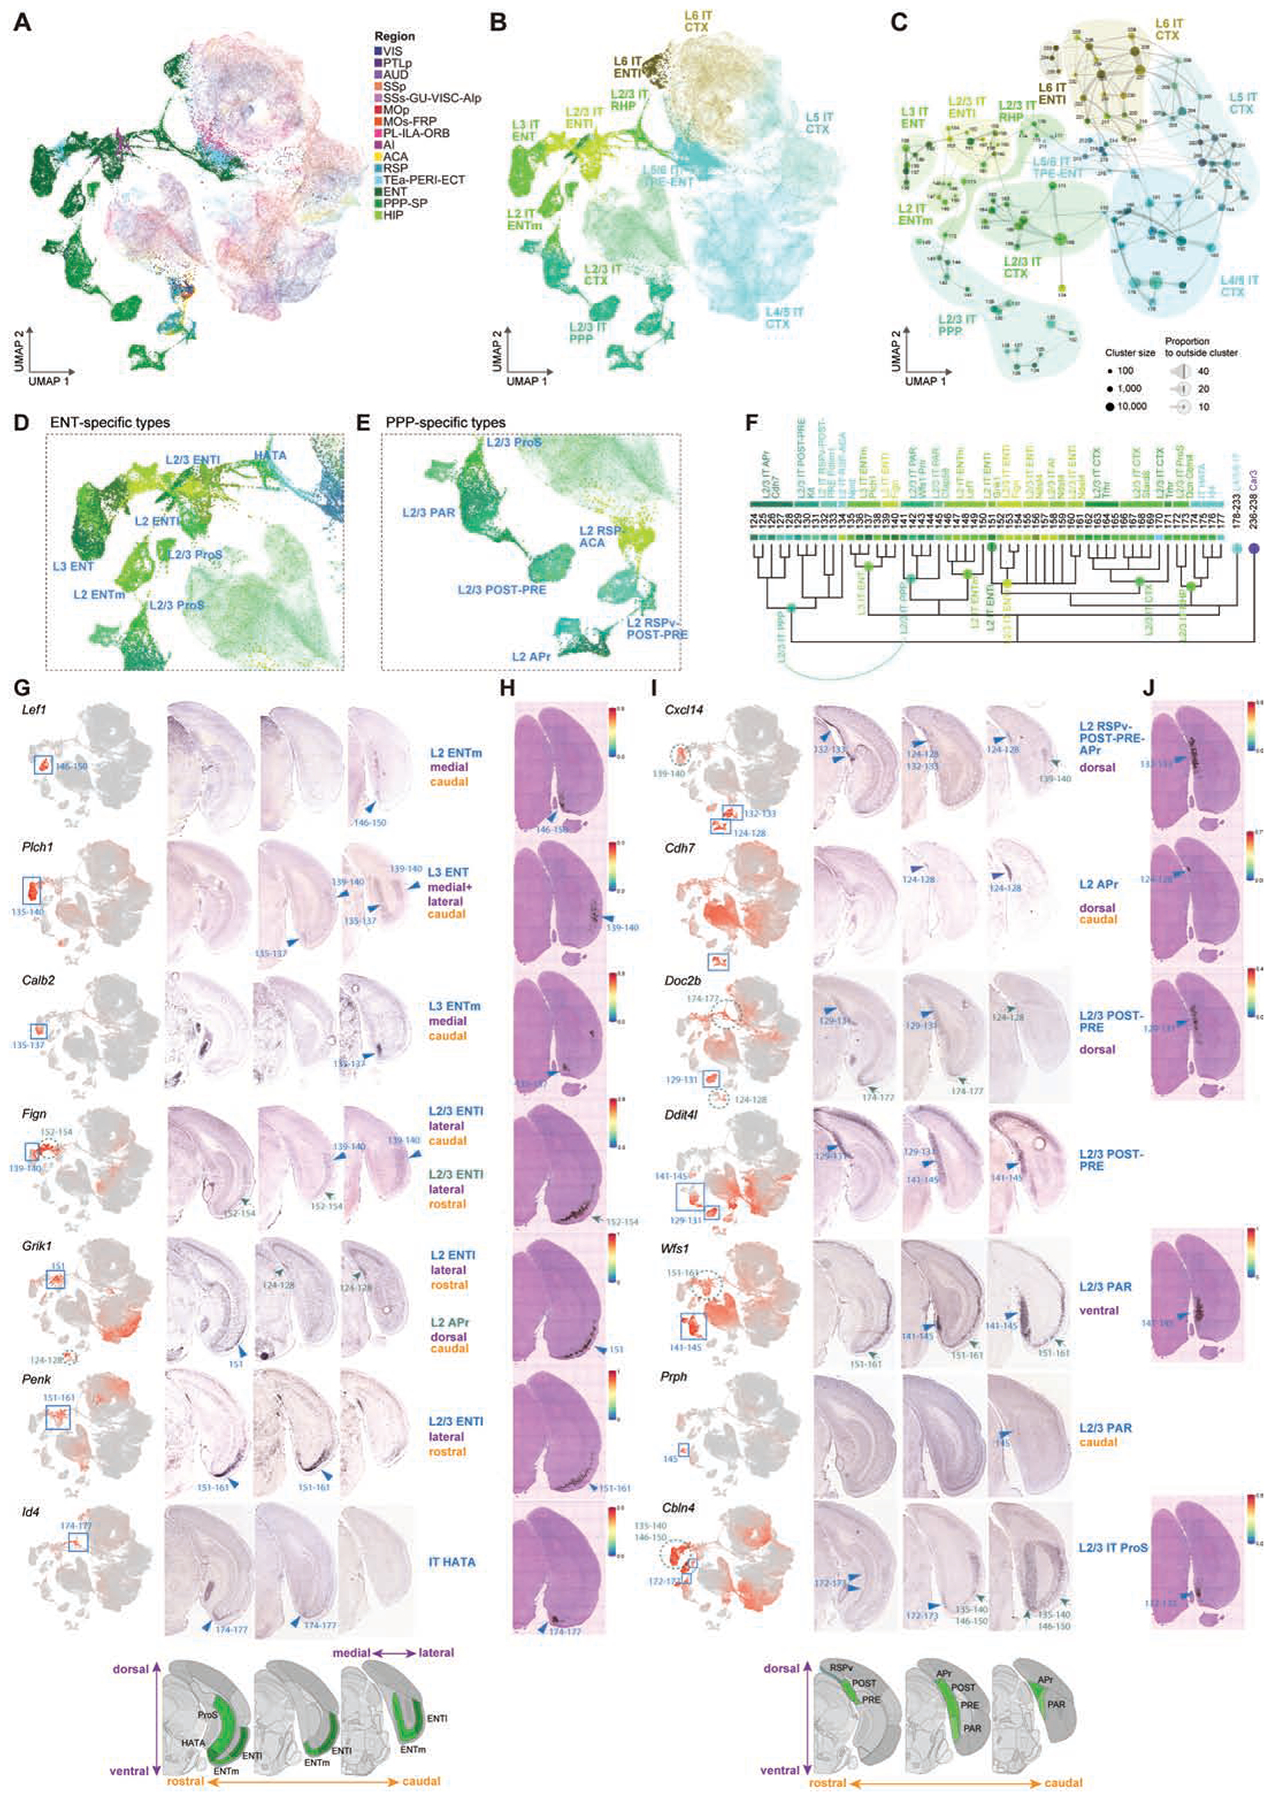
(A-B) UMAP representation of IT neurons from CTX and HPF, colored by region (A) or subclass (B). The CTX neurons are faded out.
(C) Constellation plot of IT types from CTX and HPF. Clusters are grouped by subclass.
(D-E) Enlarged view of UMAP in B of ENT- (D) or PPP-specific (E) types colored by cluster.
(F) Dendrogram of CTX, ENT and PPP IT clusters with branches annotated by subclass and supertype.
(G) Anatomical annotation of various supertypes marked in D. UMAP representations, as in B, show expression of select supertype marker genes in red (blue boxes). RNA ISH images of supertype markers along three rostral to caudal sections reveal specific locations of the different supertypes (blue arrowheads). Green dashed circles and green arrows show additional expression sites of markers.
(H) Spatial verification of supertypes shown in G using Visium. Spatial RNA-seq barcoded spots are labeled by prediction score for specified supertype.
(I-J) Same as G-H but for supertypes marked in E.