
Figure 5. Parallel sets of NP/CT/L6b and L5 PT related cell types in isocortex and hippocampal formation.
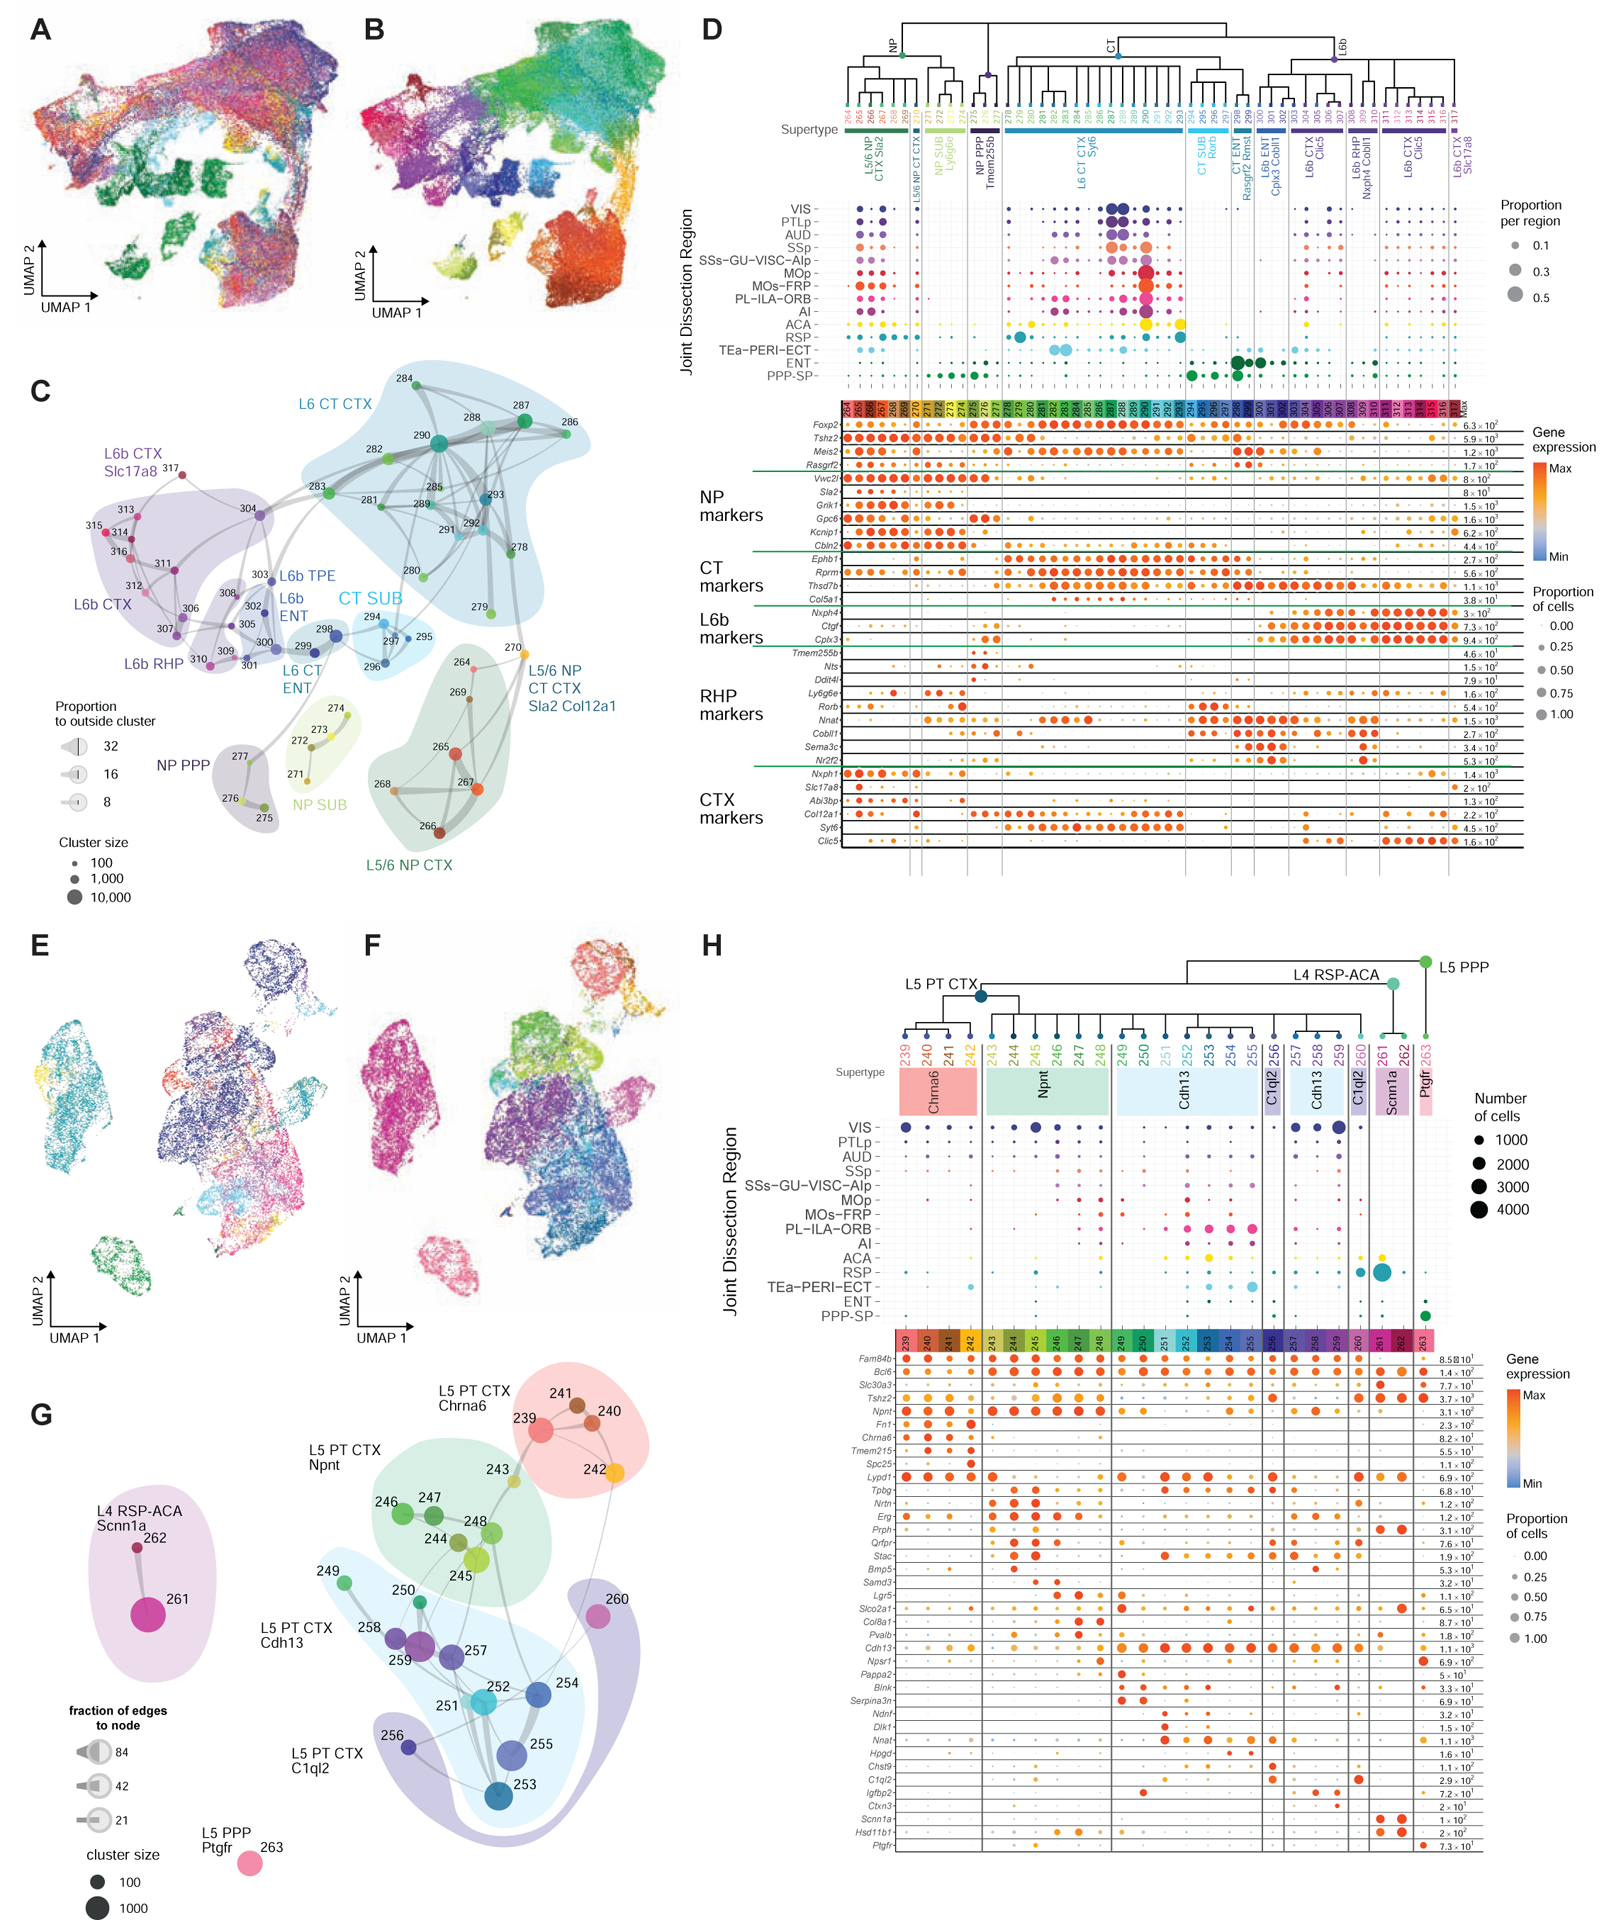
(A-B) UMAP representation of NP/CT/L6b cell types from CTX and HPF, colored by region (A) or cluster (B).
(C) Constellation plot of NP/CT/L6b clusters. Clusters are grouped by supertype.
(D) Dendrogram of NP/CT/L6b clusters followed by dot plots showing proportion of cells within each cluster derived from each region of dissection and marker gene expression in each cluster from the 10xv2 dataset. Clusters are grouped by supertype.
(E-H) Same as A-D but for L5 PT related cell types. Regional dot plot in H shows number of cells per cluster and region.
See also Figure S4.