
Figure 7. Regional gradients of distribution of glutamatergic cell types in isocortex.
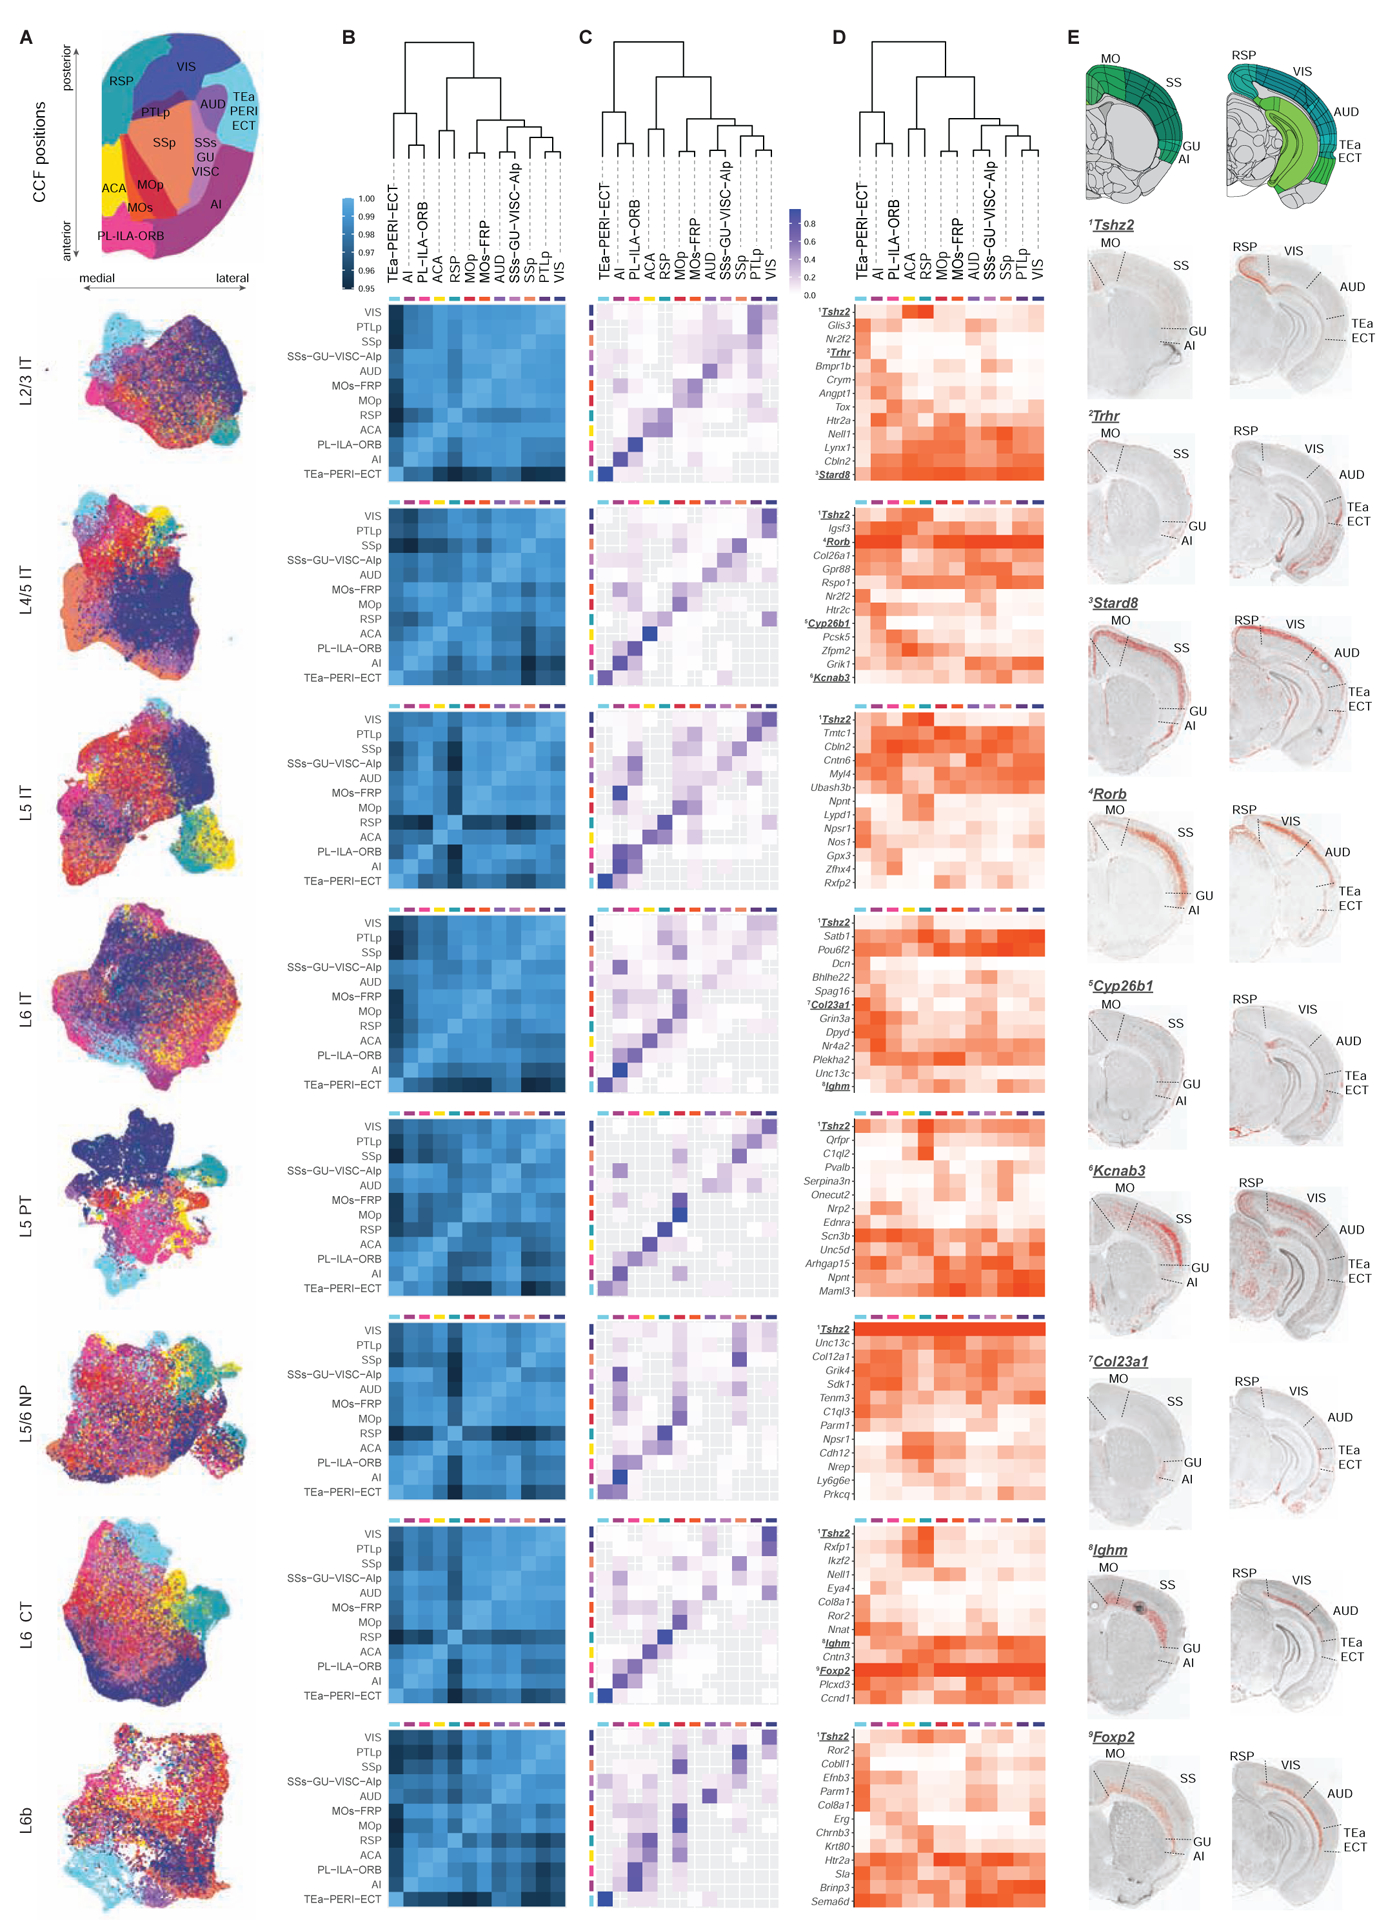
(A) UMAP plots of isocortical cells in different subclasses. At the top is a 2D flatmap representation of isocortical regions according to their positions in CCFv3.
(B) Heatmap of correlation between cortical regions for each subclass. At the top of B-D is a dendrogram of cortical regions generated based on their average gene expression within each subclass and concatenated across all subclasses.
(C) Confusion matrix of the predictability of cortical regions for each subclass. Rows and columns correspond to the actual and predicted regional identities of cells, with the rows adding up to 1.
(D) Heatmap of region-specific marker genes for each subclass. Color corresponds to fraction of cells expressing the given gene in each region.
(E) RNA ISH images for numbered genes in D, showing regional distribution of marker gene expression for specific subclasses.
See also Figures S6–S8, Data S1.