
Figure 4. Spearman correlations between placental coexpression modules and RICHS demographic characteristics.
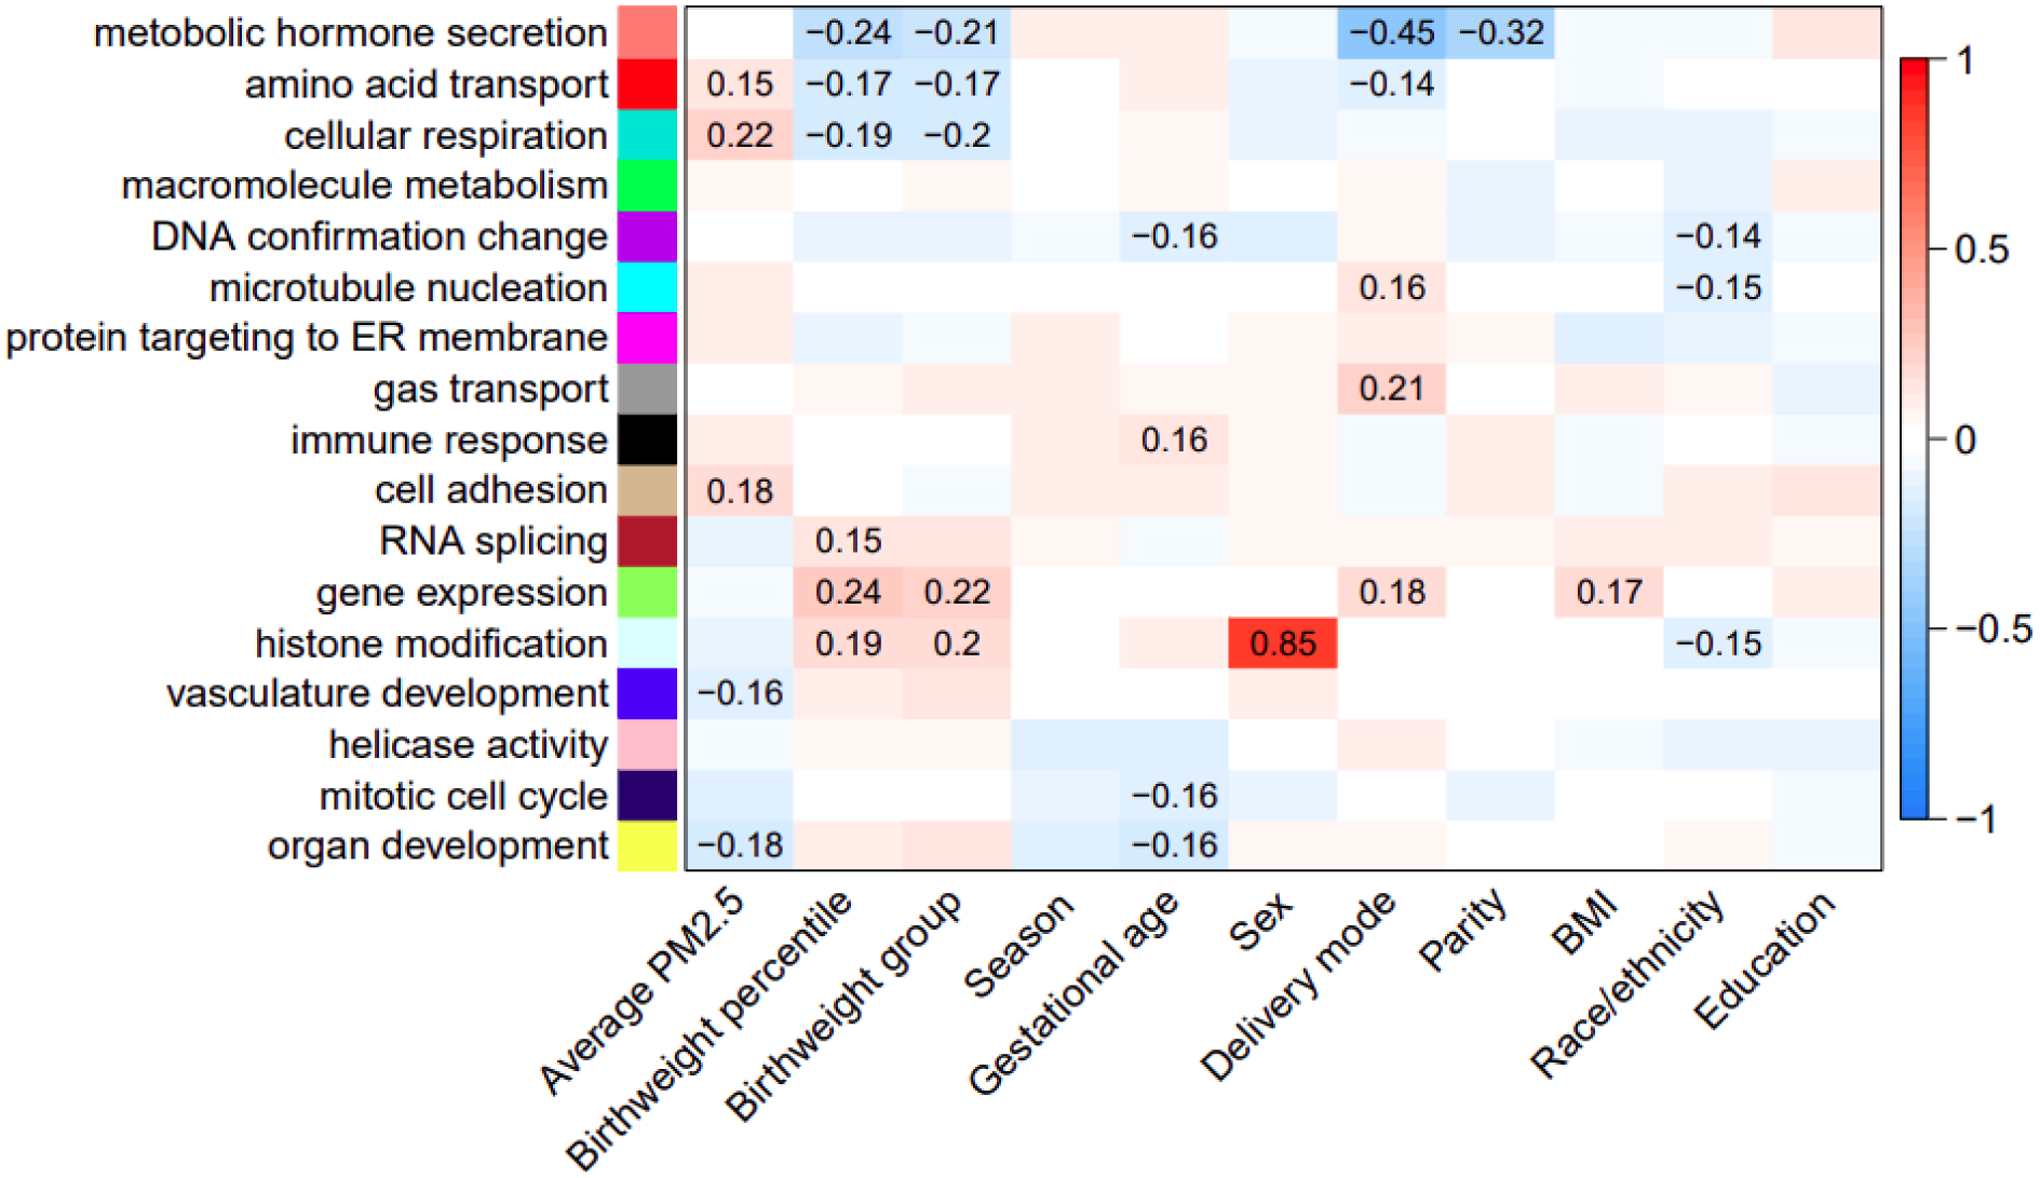
The y-axis indicates the Gene Ontology terms enriched in each module. The color gradient reflects the direction (red = positive, blue = negative) and strength of the correlation between the eigengene values of the modules (y-axis) and RICHS study participant characteristics (x-axis). Significant correlation coefficent values (p<0.05) are indicated on the plot.