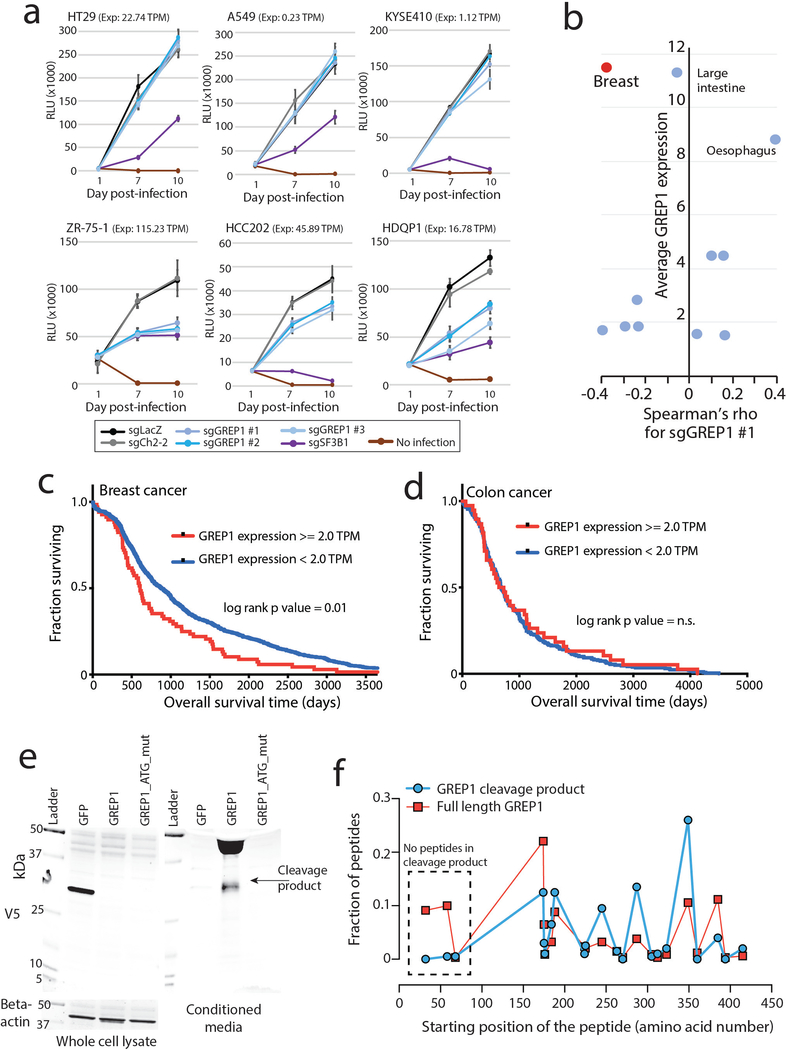
Extended Data Fig. 7. GREP1 is implicated in cell proliferation and breast cancer patient outcomes.
a) Cell viability curves following GREP1 knockout in three sensitive and three insensitive cell lines. GREP1 expression in the Cancer Cell Line Encyclopedia is indicated in transcripts per million (TPM) b) A scatter plot showing lineage-specific correlation between cell viability and GREP1 mRNA expression on the X axis with the average GREP1 expression level on the Y axis. c) Overall survival for breast cancer patients in the TCGA database stratified by GREP1 expression. N=1,036 individual patients. N=969 GREP1-high and N=67 GREP1-low patients. Significance by a one-sided log-rank P value. d) Overall survival for colon cancer patients in the TCGA database stratified by GREP1 expression. N=296 individual patients. N=38 GREP1-high and N=258 GREP1-low patients. Significance by a one-sided log-rank P value. e) Immunoblot of V5-tagged GREP1 or GFP in HEK293T cells in both whole cell lysate and conditioned media. A mutant GREP1, in which translational start sites were mutated to alanine, lacks protein translation initiation ability. Results were repeated in three independent experiments. i) Abundance of mass spec peptides detected in the full length GREP1 or cleavage product GREP1 proteins. Peptide abundance is represented as a fraction of total peptides detected. All error bars represent standard deviation.

