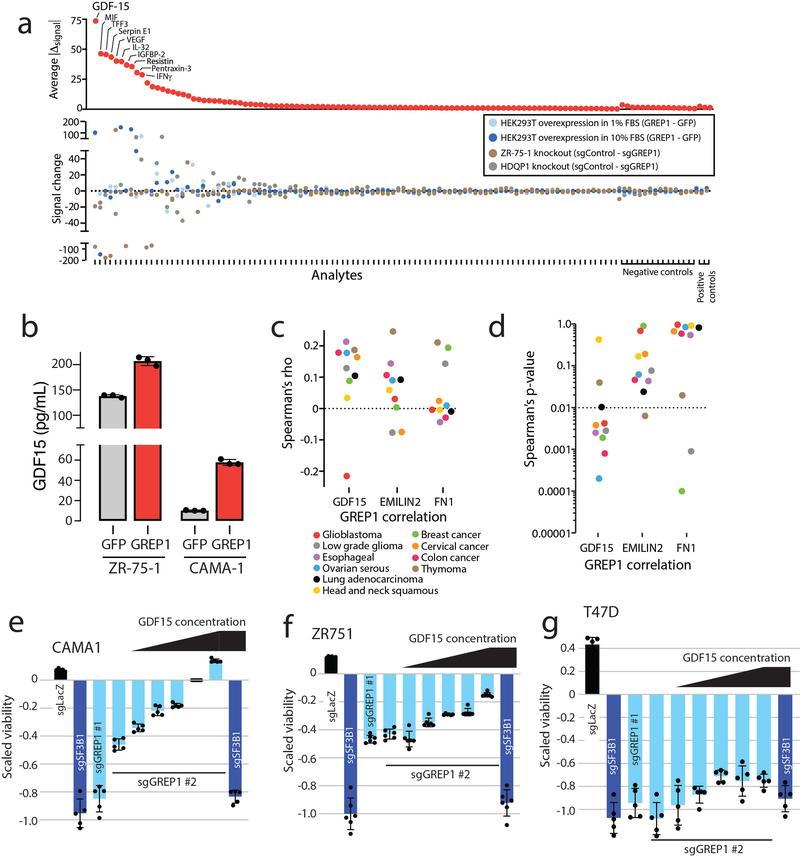
Extended Data Fig. 9. GREP1 regulates GDF15 in vitro and correlates with GDF15 expression in patient tumor tissues.
a) Cytokine profiling in HEK293T cells with transient ectopic GREP1 or GFP overexpression, ZR-75–1 cells with stable GREP1 knockout, or HDQP1 cells with stable GREP1 knockout. The change in signal abundance was calculated for each control/GREP1 pair. To rank cytokines, the average of the absolute values for the individual signal changes was plotted. b) GDF15 abundance by ELISA in ZR-75–1 and CAMA-1 cells overexpressing a GREP1 or GFP cDNA plasmid. N=3 technical replicates. N=2 independent experiments performed, with representative results shown. c) Spearman’s rho for GREP1 expression correlation with GDF15, EMILIN2, or FN1 in the indicated TCGA datasets. d) Spearman’s p value for the GREP1 correlation coefficient for GREP1 correlation with GDF15, EMILIN2, or FN1 in the indicated TCGA datasets. e-g) Recombinant GDF15 partially rescues GREP1 knockout. CAMA-1, ZR-75–1 or T47D Cas9 cells were infected with the indicated sgRNAs. 24 hours after infection, cells were treated with vehicle control or increasing concentration of recombinant human GDF15 as shown. Relative abundance was measured 7 days after infection. N=5 for all conditions in panel e. N=6 for all conditions in panel f. N=5 for all conditions in panel g. All error bars represent standard deviation. Two independent experiments were performed for panels e-g.

