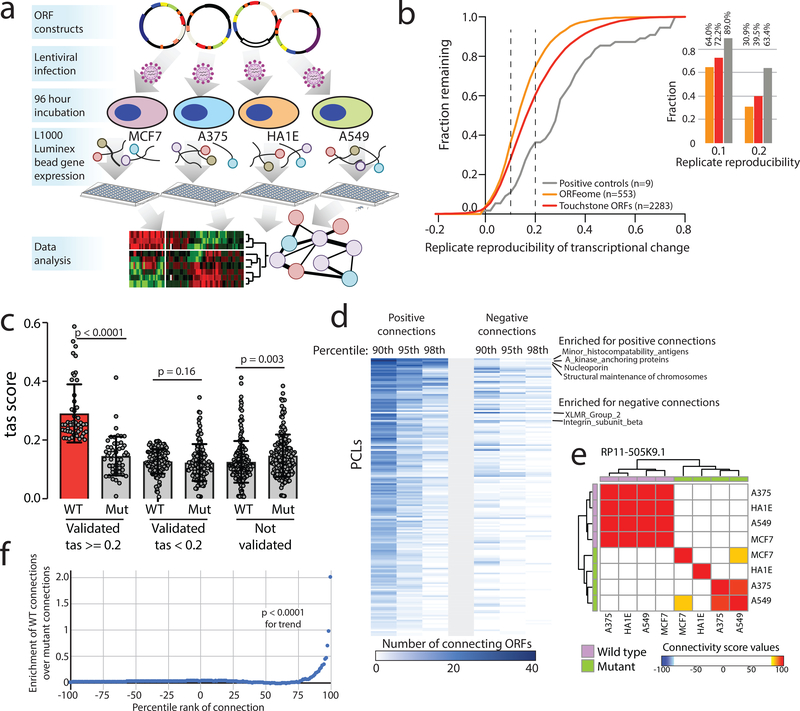
Figure 2: Defining bioactive ORFs through gene expression profiling.
a) A schematic showing the experimental set-up. Briefly, ORFs were individually transduced into 4 cell lines and expression was profiled 96 hours after infection using the L1000 platform. b) The fraction of ORFs resulting in transcriptional perturbation when overexpressed in 4 cell lines (A375, MCF7, HA1E, A549) compared to all profiled known genes and assay positive controls. Inset at the right, a barplot enumerating the percentage of ORFs in each group with a transcriptional signature above the indicated reproducibility threshold. c) A barplot showing the strength of transcriptional perturbation following expression of the indicated groups of wild-type or mutant ORF constructs. N for each pair of wild-type or mutant ORF data is indicated in the figure. P value by a two-sided Wilcoxon test. Error bars represent standard deviation. d) A heatmap showing the number of ORFs demonstrating positive or negative connections with individual Perturbational Classes (PCLs) at the indicated percentile rank. e) An example of RP11–505K9.1 showing the high concordance of connectivity signatures when the wild type ORF is expressed compared to the ORF with mutated translational start sites. f) Bland-Altman analysis demonstrating enrichment of high-ranking connectivity values following expression of wild type ORFs compared to mutant ORFs (N=19,012 for each). P value by a two-sided Wilcoxon test.

