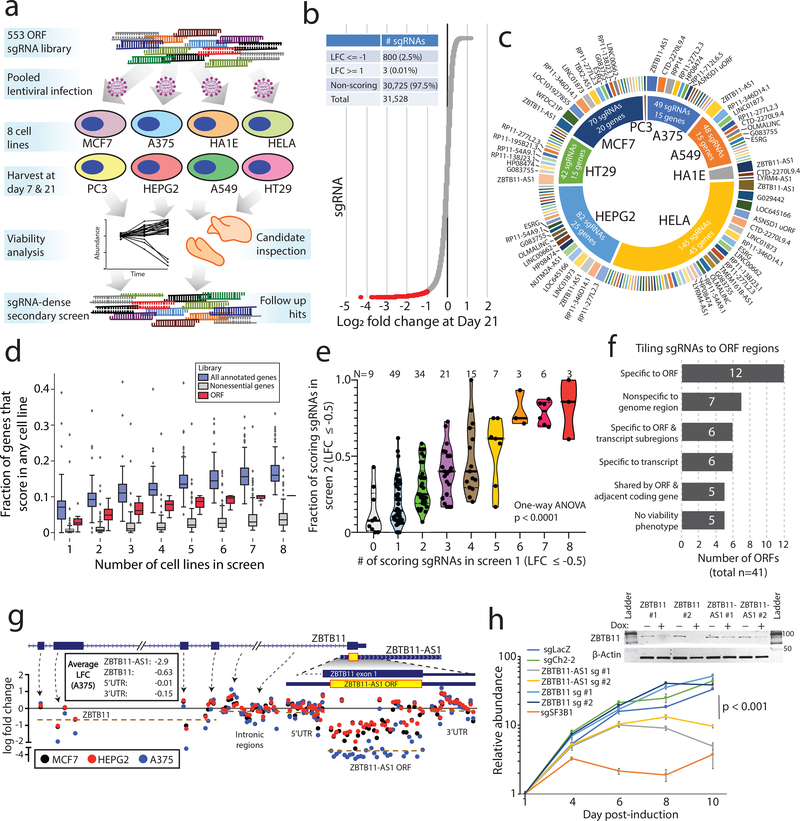
Figure 3: CRISPR screening to identify unknown ORFs implicated in cancer cell viability.
a) A schematic showing the experimental design, including a primary screen in 8 cancer cell lines and a secondary screen in 3 cancer cell lines. b) The distribution of sgRNA depletion at day +21 following lentiviral infection in the CRISPR screen across 8 cell lines. 2.5% of sgRNAs were identified as depleted in a particular cell line with a log2 fold change of <= −1. c) The distribution of nominated ORFs. For each cell line, the inner circle, the number of sgRNAs with a log2 fold change of <= −1, and the number of nominated genes are shown. The outer circle shows the ORFs nominated in that cell line, with the ORFs ranked by the number of supporting sgRNAs. The thickness of the outer circle boxes reflects the number of sgRNAs supporting that ORF’s nomination. Only ORFs nominated with >= 2 sgRNAs are shown. d) A boxplot showing the fraction of annotated genes, new ORF genes, and RNAi-defined nonessential genes that score as a vulnerability gene in the indicated number of cell lines. Each data point represents a unique cell line. The cell lines for ORF genes represent the cell lines used in this study. For annotated genes, the randomly selected cell lines from the Dependency Map were used. Box plots represent median with interquartile ranges (25% - 75%); the whiskers extend to the last data point up to 1.5x the interquartile distance from the box with individual data points shown beyond this range. e) The correlation between the number of sgRNAs producing a viability phenotype for a given ORF in the primary and the fraction of sgRNAs producing a viability phenotype in the secondary screen. The number of ORFs included in each group is indicated. P value by a one-way ANOVA. f) A barplot showing the number of ORFs with each category of viability phenotype in the tiling sgRNA CRISPR screens. g) An example of ZBTB11 and ZBTB11-AS1 for tiling CRISPR data, showing enhanced cell killing when the ZBTB11-AS1 ORF is knocked-out. Each data point represents a sgRNA. Data points are color-coded for the indicated cell lines. h) Individual CRISPR knockout experiments in a doxycycline-inducible Cas9 HeLa cell line using two sgRNAs targeting exclusively ZBTB11 or two sgRNAs targeting both the ZBTB11-AS1 ORF and ZBTB11. The line plot shows cell viability measured by cellular ATP following induction of Cas9 activity with 2ug/mL doxycycline. sgLacZ and sgCh2–2 are non-cutting and cutting negative controls, respectively, and sgSF3B1 is a pan-lethal positive control. N=6 technical replicates for each data point with two independent experiments performed. The inset western blot shows ZBTB11 protein abundance upon induction of Cas9. P value by a two-tailed Student’s t-test. Error bars represent standard deviation.

