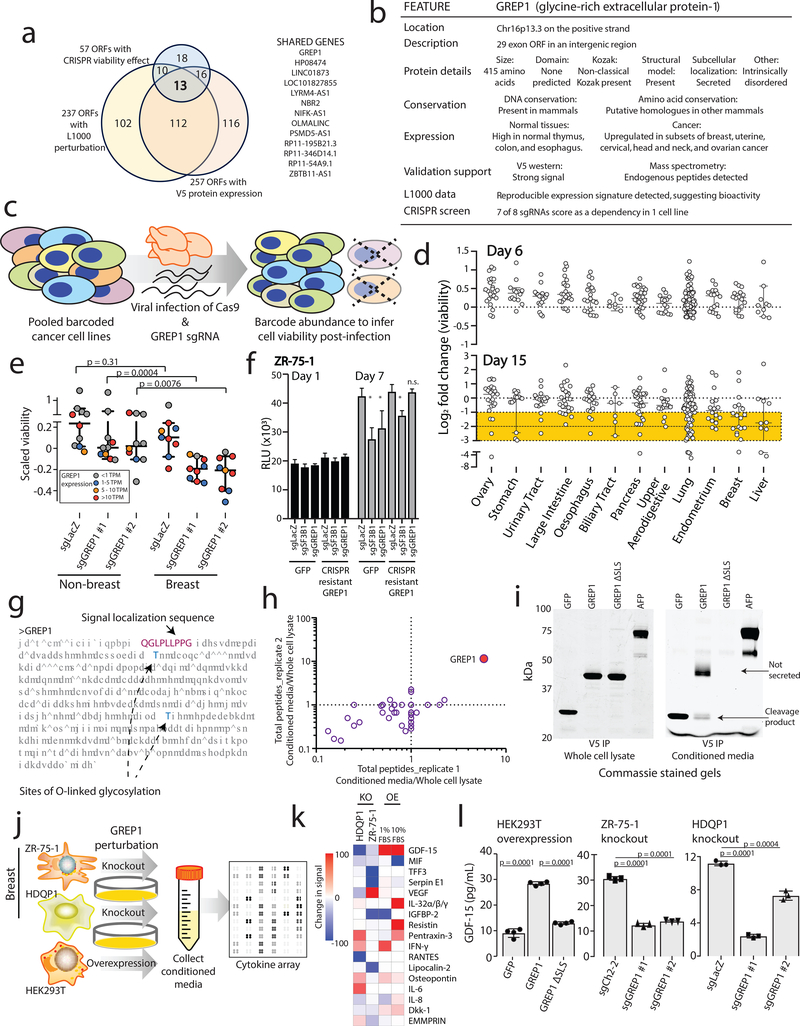
Figure 4: Characterizing GREP1 as a cancer dependency gene in breast cancer.
a) Nomination of candidate ORFs with evidence for protein translation, gene expression effect, and CRISPR phenotype. b) A table summarizing the characteristics of the GREP1 gene. c) A schematic showing the overview of pooled CRISPR screening. d) Log2 fold change abundance of cancer cell lines at Day 6 and Day 15 following pooled CRISPR screening. Cell lineages are ranked based on the median log2 fold change at Day 15. Each data point represents a unique cell line. e) Individual CRISPR validation experiments for GREP1 in a panel of non-breast (n=10) and breast (n=9) cell lines. Data are scaled so that 0 reflects the sgCh2–2 negative cutting control and −1 reflects the degree of viability loss from the sgSF3B1 positive control. Data were obtained 7 days after lentiviral infection. P value by a two-tailed Mann-Whitney test. f) Rescue of the CRISPR phenotype with overexpression of a CRISPR resistant GREP1 construct and not GFP. An asterisk (*) indicates a P value < 0.05. P values are as follows: for GFP cells, sgLacZ vs sgSF3B1 P = 0.0005, sgLacZ vs sgGREP1 P = 0.013; for GREP1 cells, sgLacZ vs sgSF3B1 P = 0.0005, sgLacZ vs sgGREP1 P = 0.08. P values by a two-tailed Student’s t-test. N=4 technical replicates per data point with two independent experiments performed. g) The GREP1 amino acid sequence with the signal localization sequence and the sites of glycosylation indicated. h) Immunoprecipitation followed by mass spectrometry of HEK293T conditioned media and whole cell lysate following ectopic expression of a pool of V5-tagged ORFs. The x and y axes represent the total number of MS peptides detected in two independent experiments. i) Expression of V5-tagged GREP1 or a truncated GREP1 lacking the N-terminal signal localization sequence in HEK293T cells. Cell lysates or conditioned media were subjected to V5 immunoprecipitation and then protein was visualized by Commassie stain. Two independent biological experiments performed. j) Experimental design for secreted cytokine profiling following GREP1 perturbation. k) A heatmap showing individual cell line changes in cytokine abundance following GREP1 perturbation. Cytokines are ranked according to the average of the absolute value of signal change for each cell line. l) Validation of GDF15 modulation upon GREP1 perturbation by ELISA in the indicated cell lines. N = 4 (HEK293T) or 3 (ZR-75–1, HDQP1) technical replicates per sample with either two (HDQP1) or three (ZR-75–1, HEK293T) independent experiments performed. P value by a two-tailed Student’s t-test. All error bars represent standard deviation.

