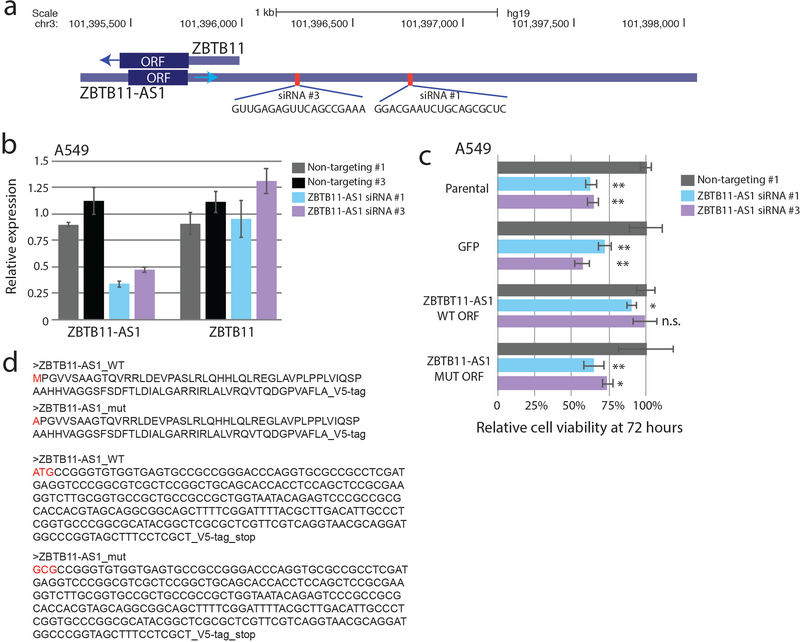
Extended Data Fig. 5. Specific siRNA knockdown of ZBTB11-AS1 mRNA transcript causes a viability phenotype which is specifically rescued by the wild type ZBTB11-AS1 ORF.
a) A schematic showing the genomic location and sequences for the two siRNAs used for ZBTB11-AS1. b) mRNA expression levels for ZBTB11-AS1 or ZBTB11 transcripts 48 hours after siRNA knockdown of ZBTB11-AS1 in A549 cells. N=3 independent replicates for all conditions. Barplots represent mean +/− standard deviation. c) Relative cell viability of A549 cells treated with ZBTB11-AS1 siRNAs at 72 hours. Parental A549 cells were used along with A549 cells expressing cDNAs for GFP, wild type ZBTB11-AS1 ORF sequence, or mutant ZBTB11-AS1 ORF lacking translational start sites. Only the wild-type ZBTB11-AS1 ORF sequence rescues the viability phenotype. N=6 independent replicates for all conditions. Barplots represent mean +/− standard deviation. d) DNA and amino acid sequences of the wild type and mutant ZBTB11-AS1 ORF cDNAs. * p < 0.05, ** p < 0.01. n.s., non-significant. For P values: Parental, non-targeting vs siRNA #1 P < 0.0001, non-targeting vs siRNA #2 P < 0.0001; GFP, non-targeting vs siRNA #1 P = 0.0008, non-targeting vs siRNA #2, P < 0.0001; WT ORF, non-targeting vs siRNA #1 P = 0.04, non-targeting vs siRNA #2 P = 0.83; MUT ORF, non-targeting vs siRNA #1 P = 0.001, non-targeting vs siRNA #2 P = 0.02. P values by a two-tailed Student’s T test.

