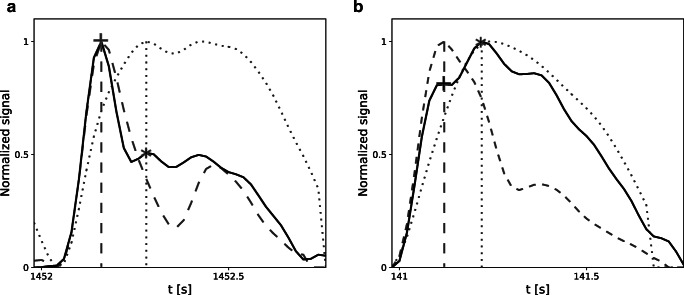
Fig. 2.
Illustrative examples of intracranial pressure (ICP) pulse waveforms from two different patients. Location of peaks P1 and P2 is indicated by cross (P1) and star (P2) signs. ICP signals are plotted with solid black lines. Additional signals used in the process of peak detection are plotted as dashed (arterial blood pressure (ABP)) and dotted (cerebral arterial blood volume (CaBV)) lines. All signals are normalized and aligned with regard to pulse onset location. Vertical lines indicate the correlation between the position of peaks P1 and P2 and the local maxima of the ABP (dashed line) and CaBV (dotted line) waveforms, respectively

