
Figure 1 |. NAT1 is required for the self-renewal of primed human iPSCs.
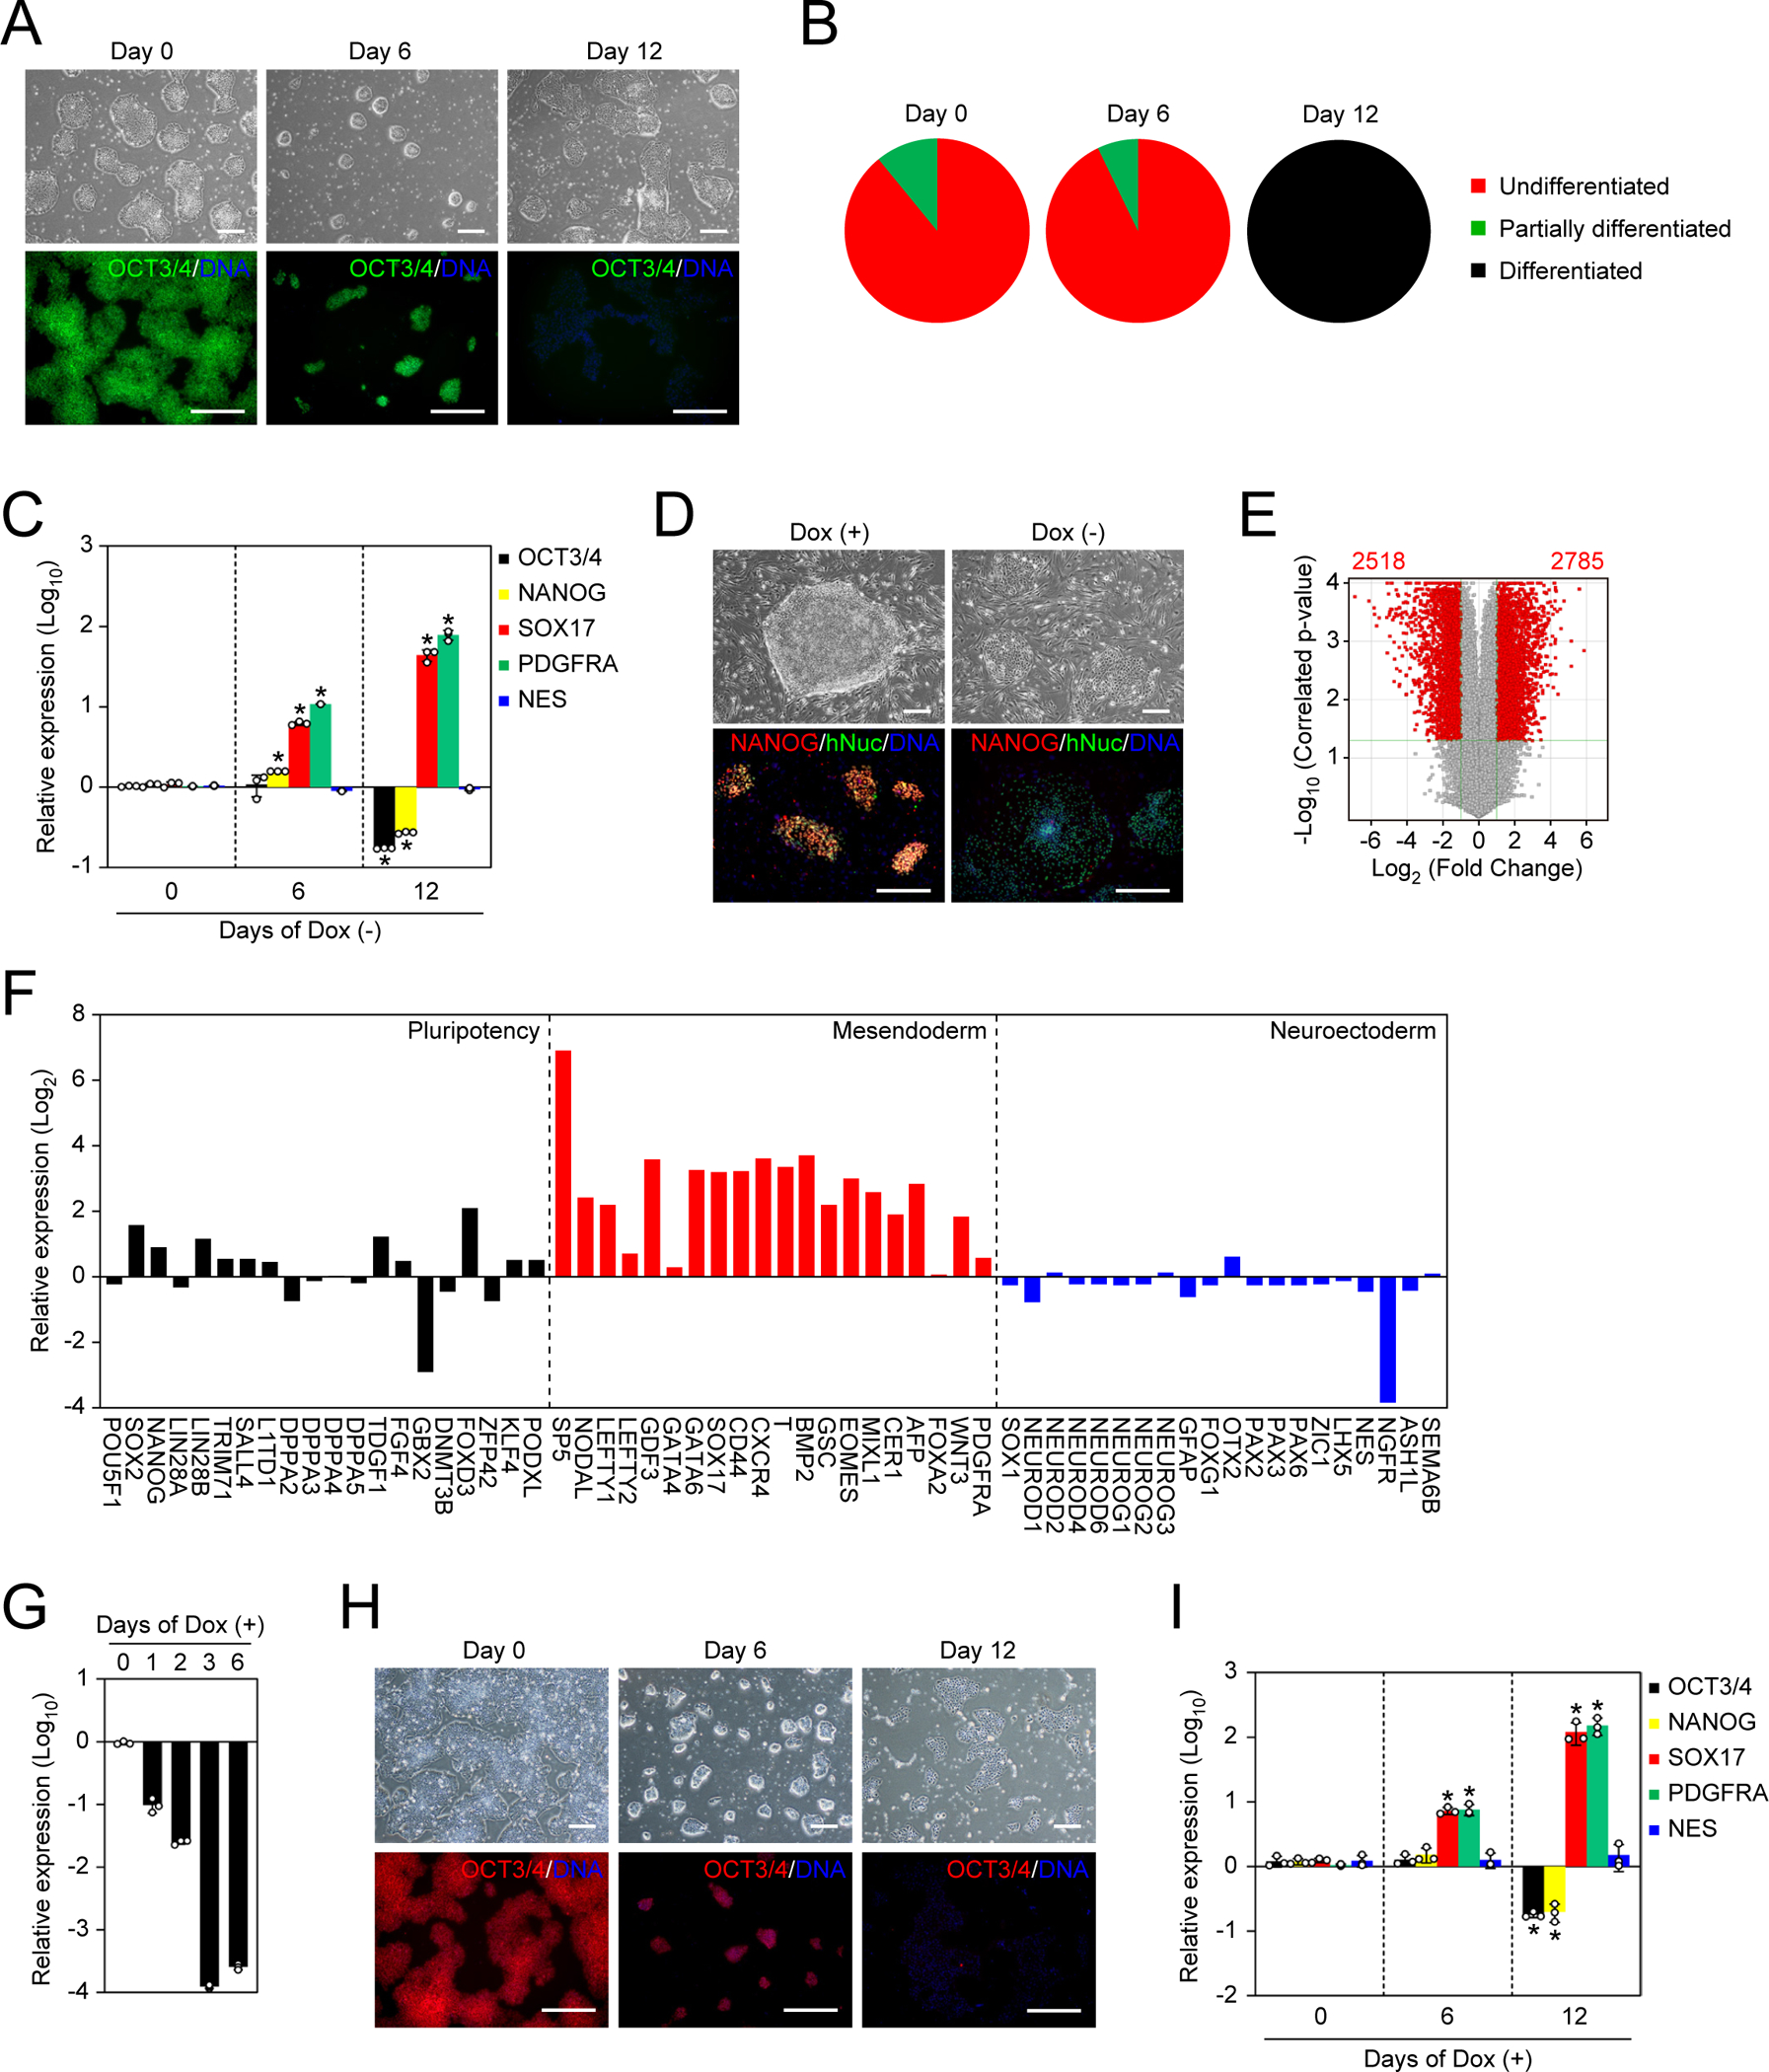
A. Representative images of NAT1 KO human iPSCs in F/A condition. Bars indicate 100 μm. See also Figure S1.
B. The loss of pluripotency by NAT1 KO was quantified by alkaline phosphatase (AP) staining.
C. Relative expression of pluripotency and differentiation markers in the time course of NAT1 KO iPSCs in F/A condition analyzed by qRT-PCR. Values are normalized by GAPDH and compared with 585A1 human iPSCs. *P<0.05 vs. day 0 by unpaired t-test. n=3.
D. Representative images of NAT1 cKO iPSCs with (+) or without (−) Dox on MEF feeders. Bars indicate 100 μm.
E. Volcano plot showing global gene expression of NAT1 cKO iPSCs maintained in F/A condition with (+) or without (−) Dox for 6 days. Red dots indicate differentially expressed genes with statistical significance (FC>2, FDR<0.05). Pearson correlation coefficient was 0.9787. n=3.
F. Relative expression of pluripotency, mesendodermal and neuroectodermal genes in NAT1 cKO iPSCs maintained in F/A condition with no Dox for 6 days compared with the same iPSCs with Dox analyzed by microarray. n=3.
G. Relative expression of NAT1 on days 0–6 of Dox addition in F/A condition by qRT-PCR. Values are normalized by GAPDH and compared with 1B4 human iPSCs. n=3.
H. Representative images of human iPSCs in the time course of NAT1 KD. Bars indicate 100 μm.
I. Relative expression of pluripotency and differentiation markers in the cells shown in Fig. 1G by qRT-PCR. Values are normalized by GAPDH and compared with 1B4 human iPSCs. *P<0.05 vs. day 0 by unpaired t-test. n=3.