
Figure 3 |. Loss of NAT1 enhances HERV-Hs to inhibit neural differentiation.
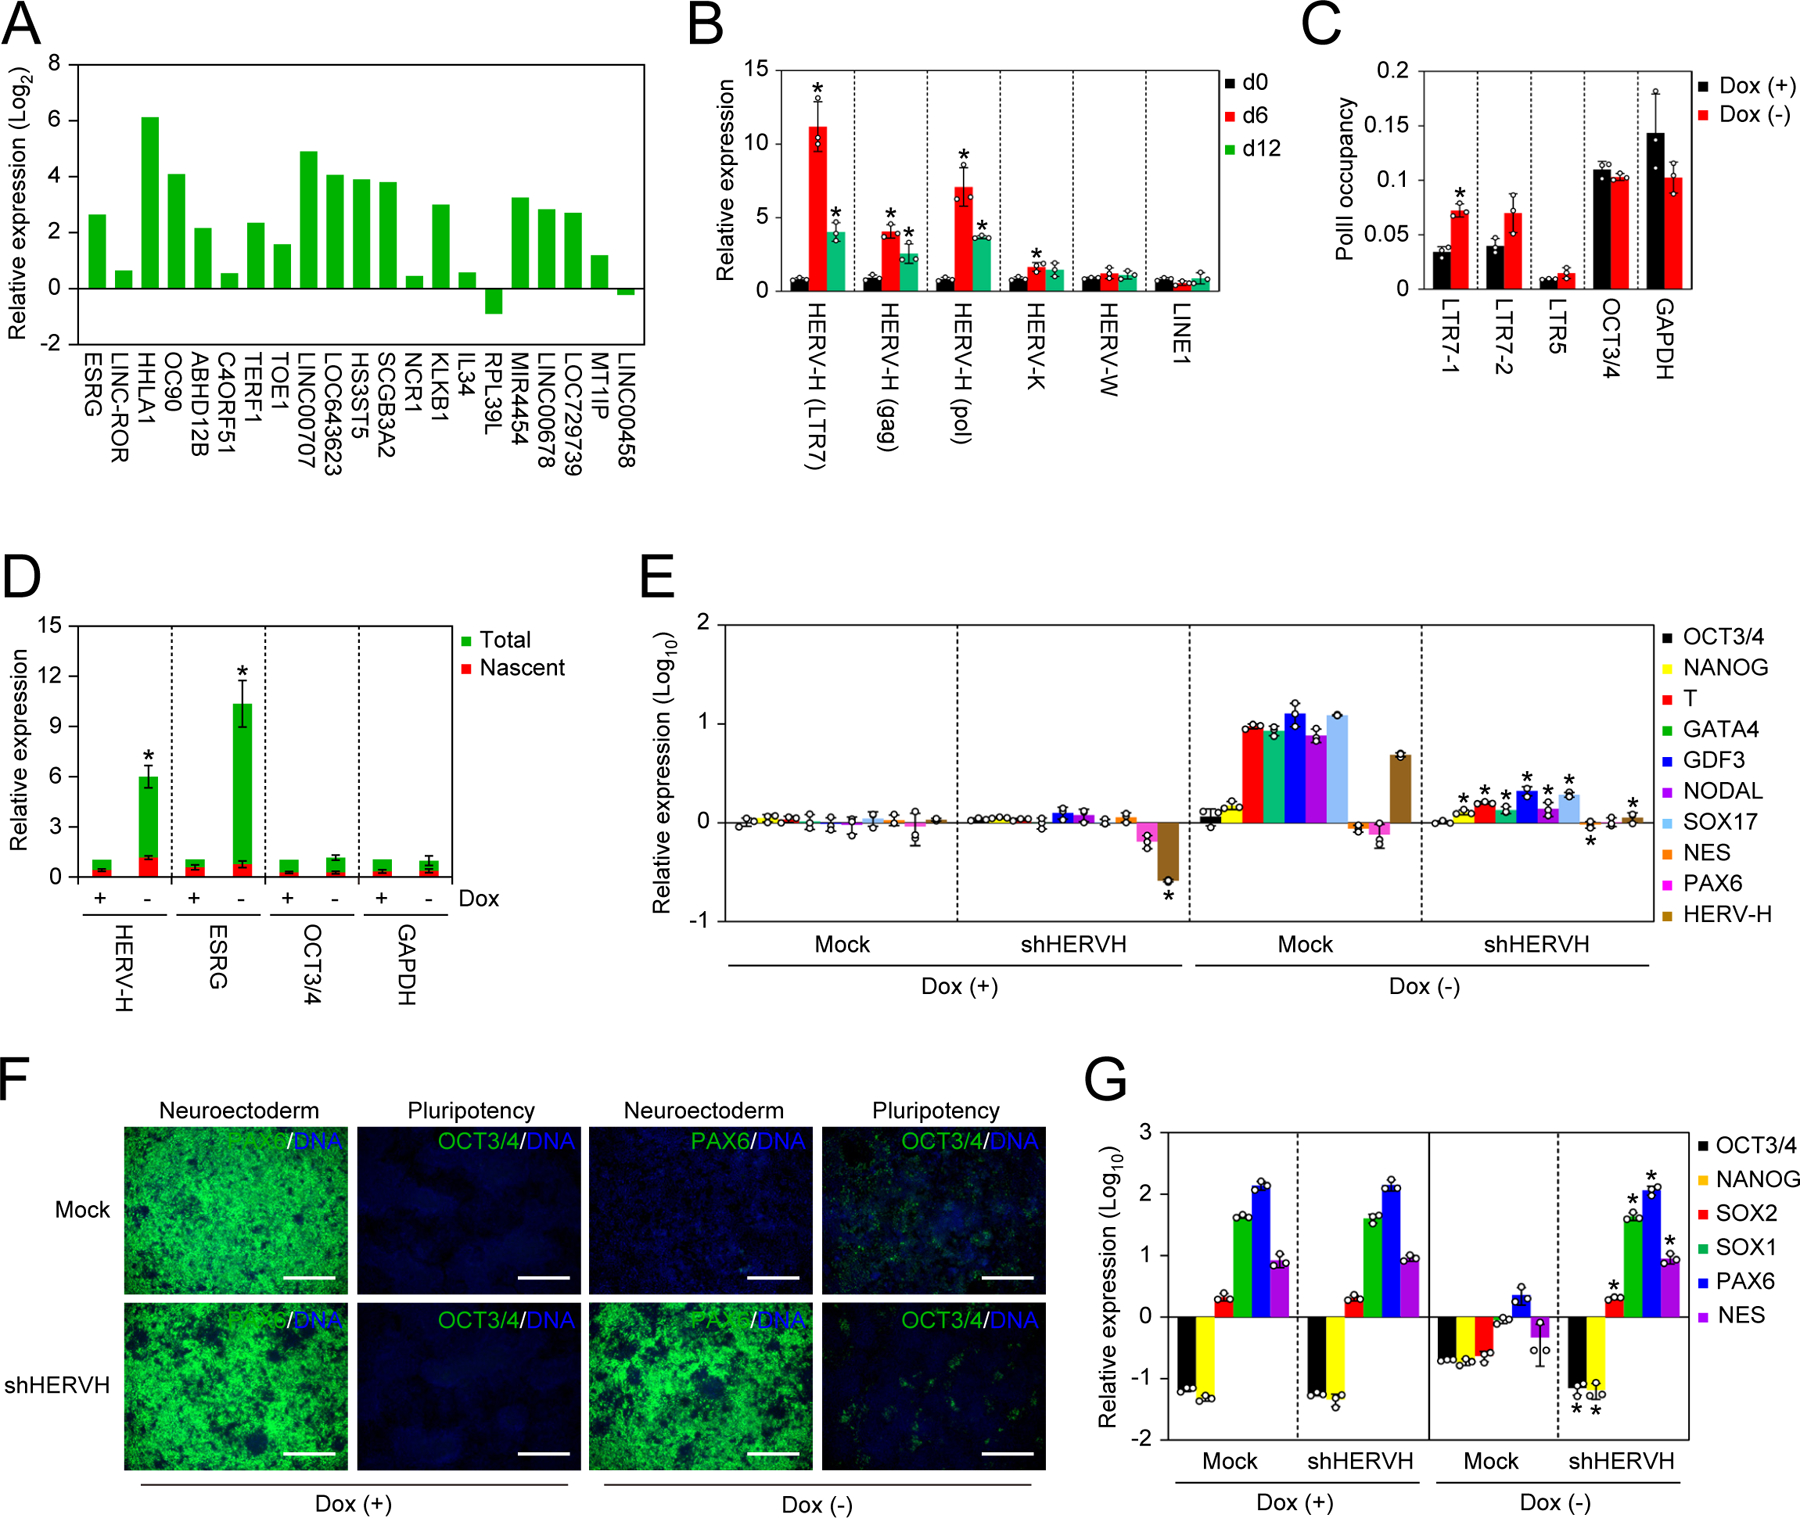
A. Relative expression of HERV-H-related transcripts in NAT1 cKO human iPSCs maintained in F/A condition with no Dox compared to those in same cell line with Dox analyzed by microarray. n=3.
B. Relative expression of transposable elements in NAT1 cKO human iPSCs maintained in F/A condition on days 0, 6 and 12 of Dox removal analyzed by qRT-PCR. Values are normalized by GAPDH and compared with 585A1 human iPSCs. *P<0.05 vs. day 0 by unpaired t-test. n=3.
C. Fold enrichment of PolII occupancy on the promoter regions of HERVs, OCT3/4 and GAPDH in NAT1 cKO human iPSCs maintained in F/A condition with or without Dox for 6 days analyzed by qPCR. n=3. Values are normalized by input control. *P<0.05 vs. Dox (+) by unpaired t-test. n=3.
D. Relative amounts of total and nascent transcribed pan HERV-Hs, ESRG, OCT3/4 and GAPDH RNAs in NAT1 cKO human iPSCs maintained in F/A condition with or without Dox for 6 days analyzed by qPCR. Values are normalized by spike RNA control and compared with the total of Dox (+). *P<0.05 vs. Dox (+) by unpaired t-test. n=3.
E. Relative expression of pluripotency and differentiation markers in NAT1 cKO human iPSCs transfected with Mock or HERV-H shRNA (shHERVH) maintained in F/A condition with (+) or without (−) Dox for 6 days. Values are normalized by GAPDH and compared with 585A1 human iPSCs. *P<0.05 vs. Mock by unpaired t-test. n=3. See also Figure S2.
F. Immunocytochemistry of differentiated NAT1 cKO human iPSCs transfected with Mock or HERV-H shRNA (shHERVH) in the presence (+) or absence (−) of Dox by dSMADi. Bars indicate 100 μm. See also Figure S2.
G. Relative expression of pluripotency and neural genes in the cells shown in Fig. 3F analyzed by qRT-PCR. Values are normalized by GAPDH and compared with 585A1 human iPSCs. *P<0.05 vs. Mock by unpaired t-test. n=3. See also Figure S2.