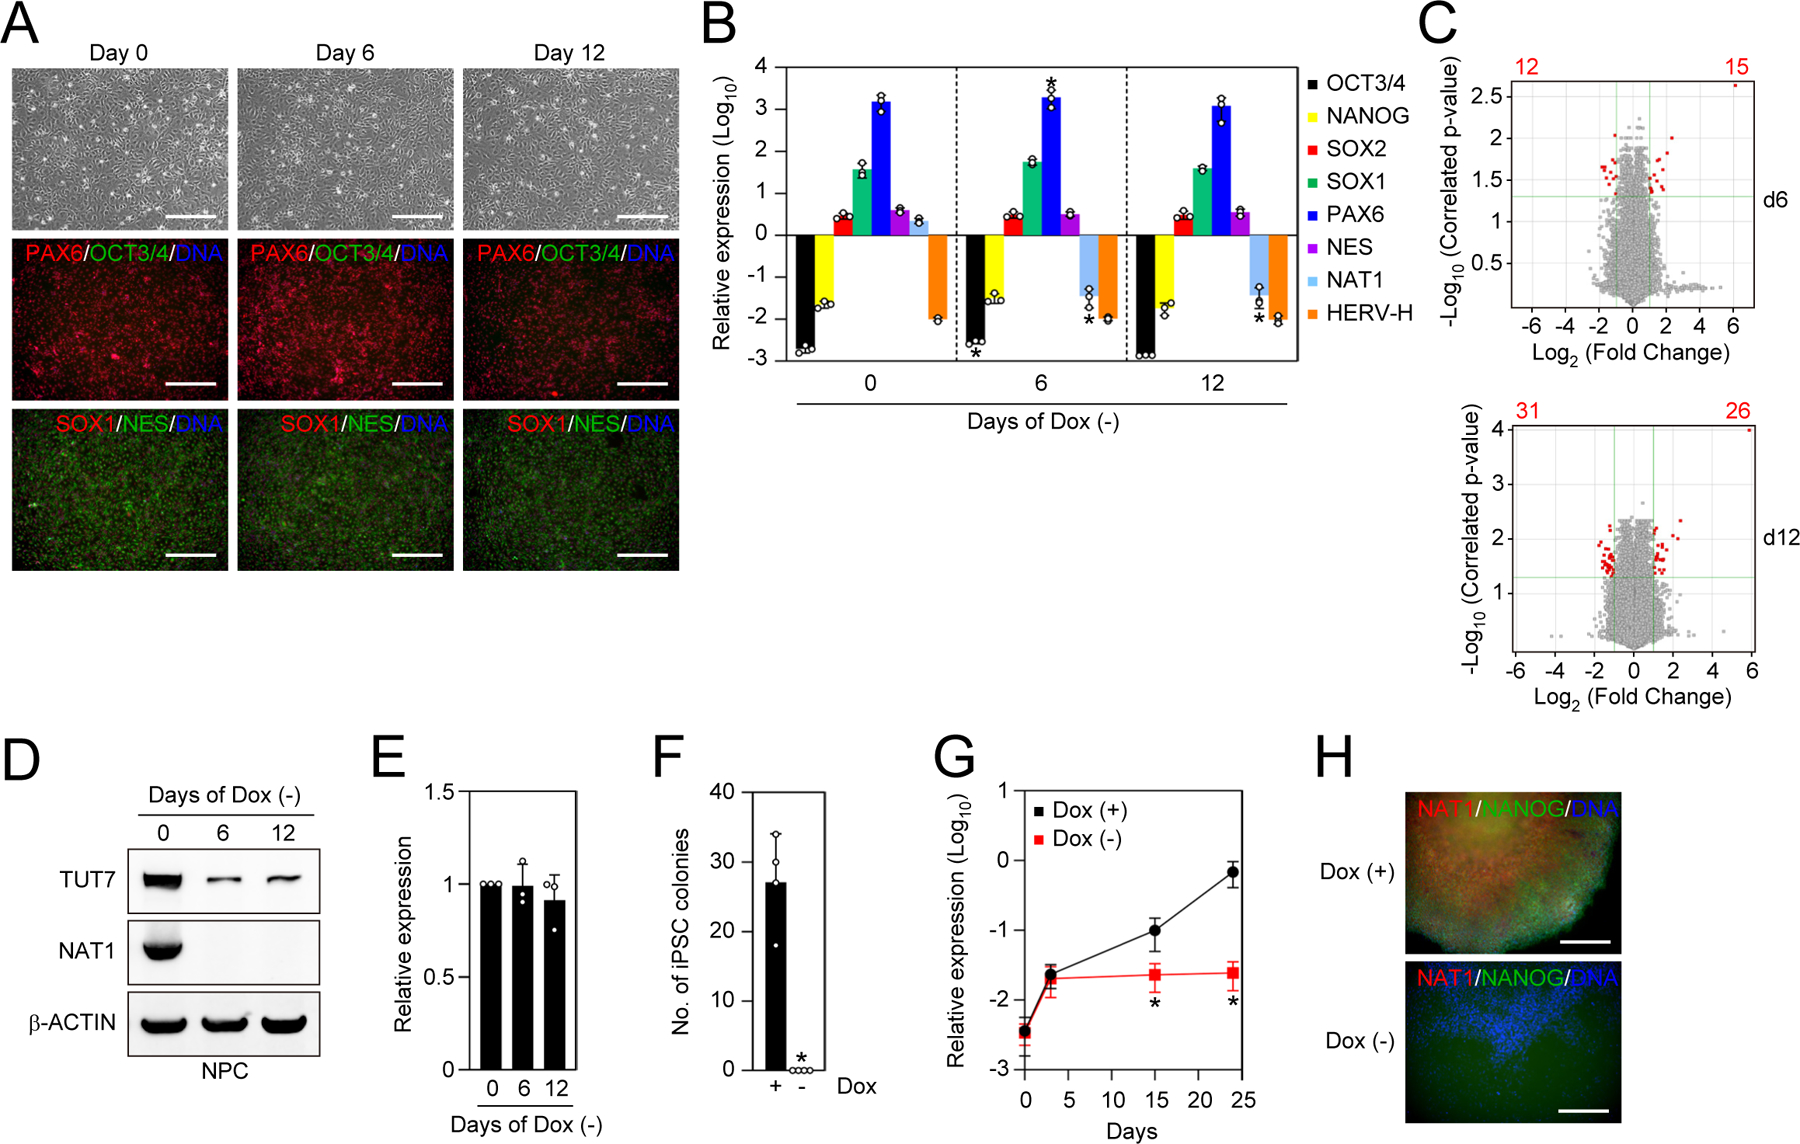
Figure 6 |. NAT1 is dispensable for the self-renewal of NPCs.

A. The generation of NAT1 cKO human NPCs under the presence of NAT1 transgene expression. Shown are representative images of NAT1 cKO human iPSC-derived NPCs cultured with (day 0) or without (days 6 and 12) Dox. Bars indicate 100 μm.
B. Relative expression of pluripotency and neural genes in NAT1 cKO human iPSC-derived NPCs cultured with (day 0) or without (days 6 and 12) Dox analyzed by qRT-PCR. Values are normalized by GAPDH and compared with 585A1 human iPSCs. *P<0.05 vs. day 0 by unpaired t-test. n=3.
C. Volcano plots showing global gene expression of NAT1 cKO human iPSC-derived NPCs cultured with or without Dox for 6 (d6) and 12 (d12) days. Red dots indicate differentially expressed genes with statistically significance (FC>2, FDR<0.05). Pearson correlation coefficients of the d6 and d12 samples were 0.9966 and 0.9969, respectively. n=3.
D. Western blots of NAT1 cKO human NPCs on days 0, 6 and 12 after Dox removal.
E. Relative expression of TUT7 in the cells shown in Fig. 6D analyzed by qRT-PCR. Values are normalized by GAPDH and compared with the sample on day 0. *P<0.05 vs. day 0 by unpaired t-test. n=3.
F. Number of AP (+) iPSC colonies from 5×10⁴ OSKM-transduced NAT1 cKO human NPCs in the presence (+) or absence (−) of Dox on day 24. *P<0.05 vs. Dox (+) by unpaired t-test. n=4.
G. Relative expression of NANOG in the cultures of OSKM-transduced NAT1 cKO NPCs with (+) or without (−) Dox on days 0, 3, 15 and 24 analyzed by qRT-PCR. Values are normalized by GAPDH and compared with 585A1 iPSCs. *P<0.05 vs. Dox (+) by unpaired t-test. n=3.
H. Immunocytochemistry of the cultures of OSKM-transduced NAT1 cKO NPCs with (+) or without (−) Dox on day 24. Bars indicate 100 μm.
