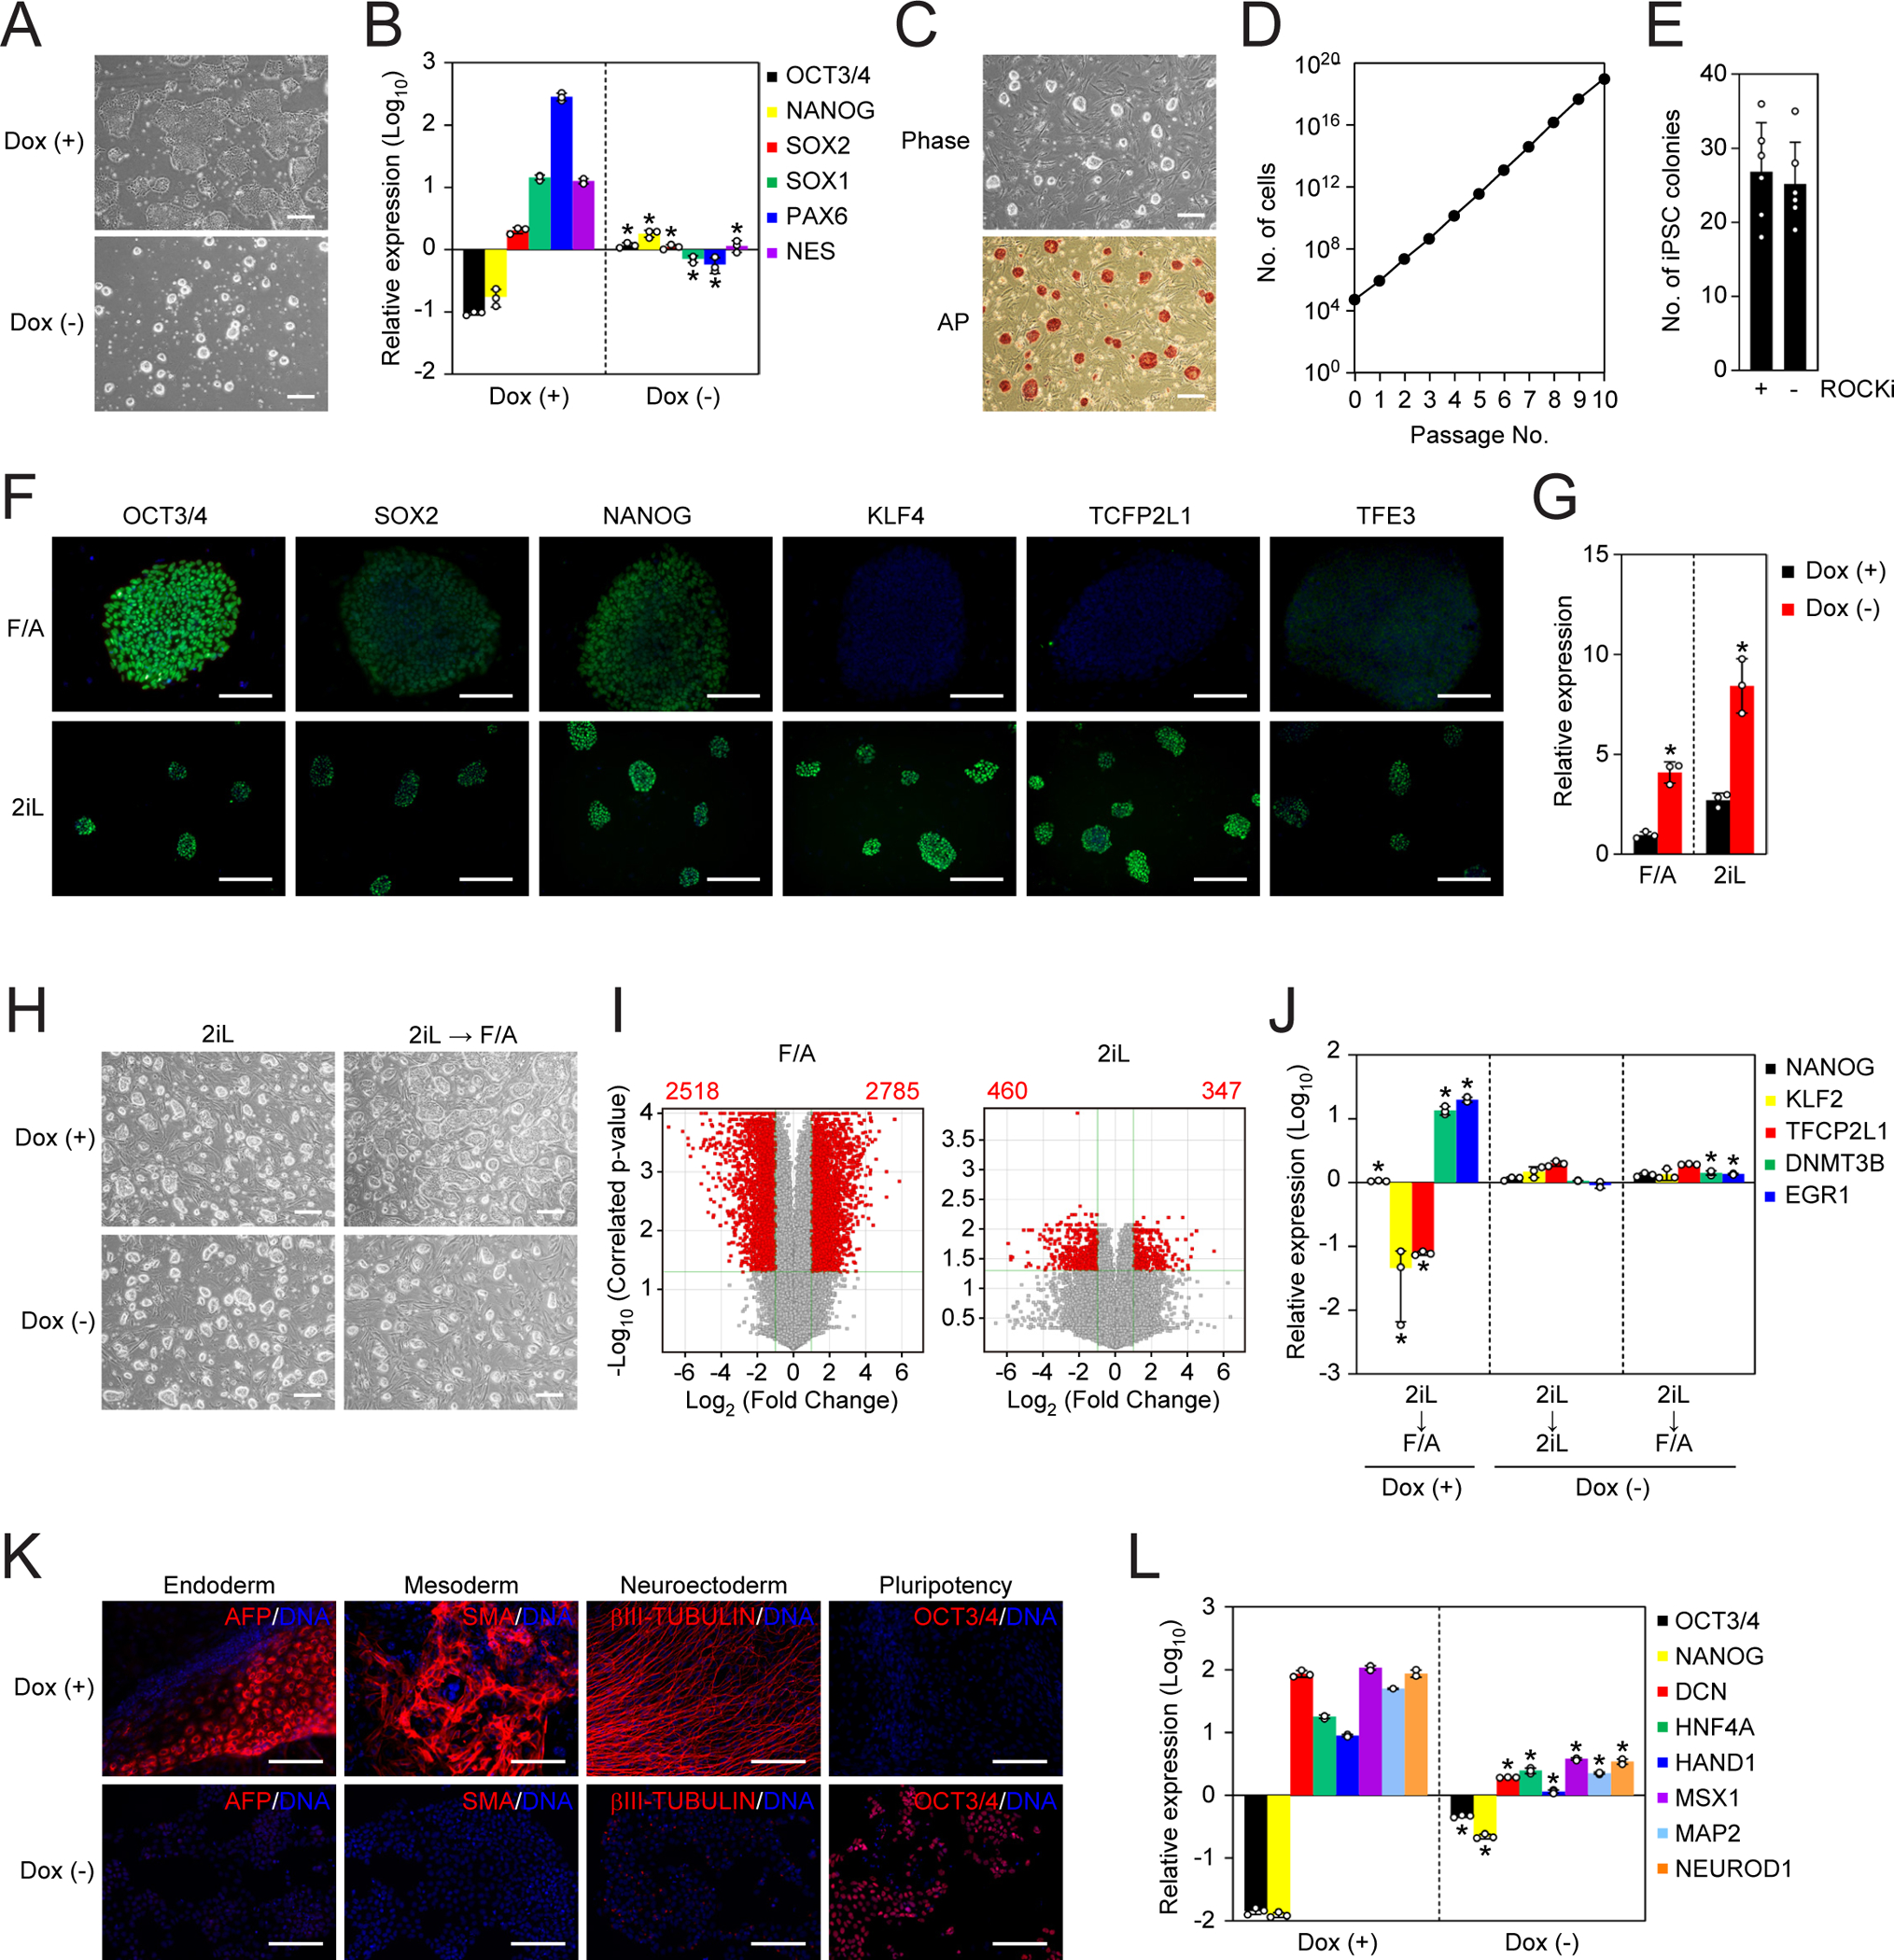
Figure 7 |. Loss of NAT1 restricts the differentiation of naïve-like human iPSCs.

A. Representative images of NAT1 cKO human iPSCs maintained with (+) or without (−) Dox in 2iL condition for 6 days. Bars indicate 100 μm.
B. Relative expression of pluripotency and neural genes in the cells shown in Fig. 7A analyzed by qRT-PCR. Values are normalized by GAPDH and compared with 585A1 iPSCs. *P<0.05 vs. Dox (+) by unpaired ttest. n=3.
C. Representative images of NAT1 KO iPSCs converted to the naïve-like state. Phase contrast image (upper) and AP stained image (lower) are shown. Bars indicate 100 μm.
D. Growth curve of NAT1 KO iPSCs converted to the naïve-like state.
E. Colony formation efficiency of naïve-like NAT1 KO human iPSCs plated with (+) or without (−) ROCK inhibitor (ROCKi). n=6.
F. Immunocytochemistry of pluripotency markers in NAT1 cKO human iPSCs in F/A or 2iL conditions. Bars indicate 50 μm.
G. Relative expression of HERV-Hs in NAT1 cKO human iPSCs in F/A or 2iL condition with (+) or without (−) Dox. Values are normalized by GAPDH and compared with 585A1 human iPSCs. *P<0.05 vs. Dox (+) by unpaired t-test. n=3.
H. Representative phase contrast images of NAT1 cKO human iPSCs with (+) or without (−) Dox in 2iL condition or after transferring from 2iL to F/A condition. Bars indicate 100 μm.
I. Volcano plots showing global gene expression of NAT1 cKO human iPSCs with (+) or without (−) Dox in F/A (left) or 2iL (right) condition. Red dots indicate differentially expressed genes with statistical significance (FC>2, FDR<0.05). Pearson correlation coefficients of F/A and 2iL samples were 0.9787 and 0.9827, respectively. n=3. The data of F/A samples are identical to those shown in Fig. 1E.
J. Relative expression of naïve and primed pluripotency markers in the cells shown in Fig. 7H analyzed by qRT-PCR. Values are normalized by GAPDH and compared with Dox (+) in 2iL. *P<0.05 vs. 2iL by unpaired t-test. n=3.
K. Immunocytochemistry of differentiated cells derived from naïve-like NAT1 cKO human iPSCs in the presence (+) or absence (−) of Dox by EB formation. Bars indicate 100 μm.
L. Relative expression of pluripotency and differentiation markers in the cells shown in Fig. 7K compared with naïve-like human iPSCs analyzed by qRT-PCR. Values are normalized by GAPDH. *P<0.05 vs. Dox (+) by unpaired t-test. n=3.
