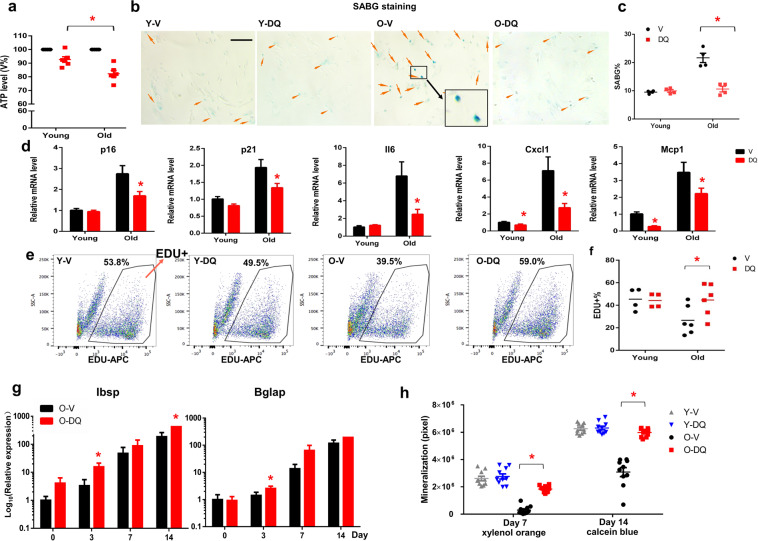
Fig. 1. D + Q improved proliferation and osteogenic capacity of old BMSCs in vitro.
a ATP assay of young and Old V or DQ treated BMSCs. n = 6 for both groups. b Representative images of senescence-associated β-gal (SABG) staining. Scale bar: 50 μm (c) Percentage of SABG positive cells. n = 4 for both groups. d Expression of p16, p21, Il6, Cxcl1, MCP1 was analyzed by real-time PCR at day 0. n = 10 (male and female donors combined) for both groups. e FACS analysis on EDU + cells. f Percentage of EDU + cells of the total cells. n = 4 for young groups and n = 6 for old groups. g Expression of Ibsp and Bglap was analyzed by real-time PCR at day 0, 3, 7, and 14 after the exposure to osteogenic media. n = 6 for both groups. h Old V or DQ treated BMSCs were differentiated in osteogenic media. The same wells were stained with xylenol orange at day 7 and calcein blue at day 14 to quantify the mineralization area at both time points. n = 10 (male and female donors combined) for both groups. Results were shown as means ± s.e.m. *p < 0.05; two-tailed Student’s t-test.

