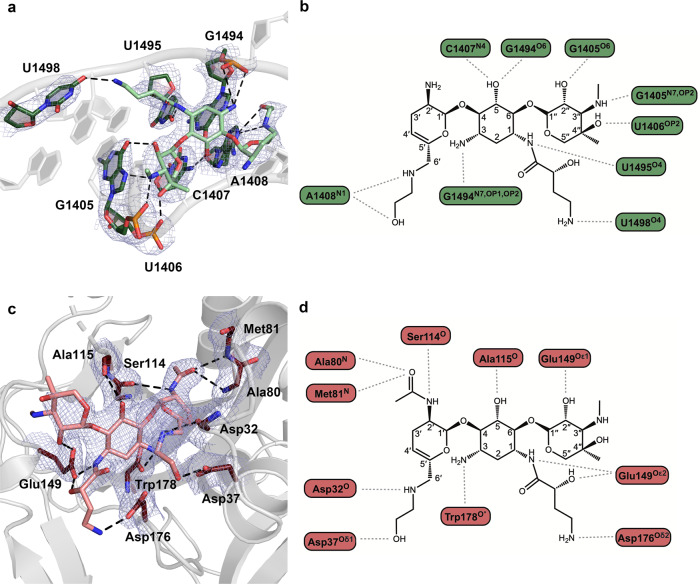
Fig. 1. The ribosomal A-site and AAC(2′)-Ia hydrogen bond interactions with plazomicin.
a Ribosomal A-site bases involved in interactions depicted as sticks and colored in dark green, plazomicin colored in light green. Hydrogen bonds are depicted as black dashed lines. The composite 2Fo–Fc map is contoured to 1σ and colored in blue. b A 2-dimensional representation of hydrogen bond interactions between plazomicin and the ribosomal A-site. c AAC(2′)-Ia residues involved in interactions depicted as sticks and colored in dark red, acetylated plazomicin colored in salmon. The composite 2Fo–Fc map is depicted as in (a). d A 2-dimensional representation of hydrogen bond interactions between acetylated-plazomicin and AAC(2′)-Ia.

