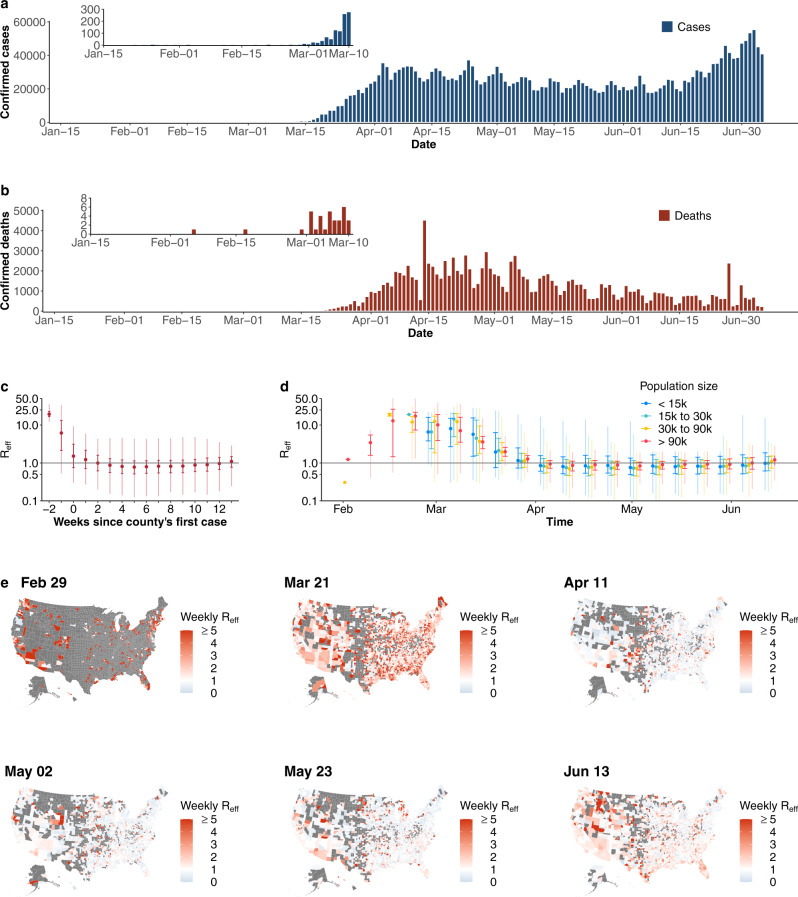
Fig. 1. Confirmed COVID-19 cases and reproduction numbers (Reff) in the United States.
a Daily confirmed COVID-19 cases. b Daily confirmed COVID-19 deaths. c Distribution of Reff by weeks since the county’s first reported case (n = 36,737 county-weeks). Gray horizontal line indicates the threshold of Reff = 1 (same as in c). Medians (points), interquartiles (dark vertical lines) and 95% percentiles (light vertical lines) are shown (same as in d). d Temporal distribution of Reff stratified by county population size. County population size was classified into four groups, i.e., <15,000 (blue, n = 7656 county-weeks), 15,000–30,000 (green, n = 8139 county-weeks), 30,000–90,000 (orange, n = 10,929 county-weeks) and >90,000 (red, n = 10,013 county-weeks). e Map of county Reff for representative weeks. Weeks were selected with a 3-week interval from the last week when Reff were available. Gray indicates no data available.

