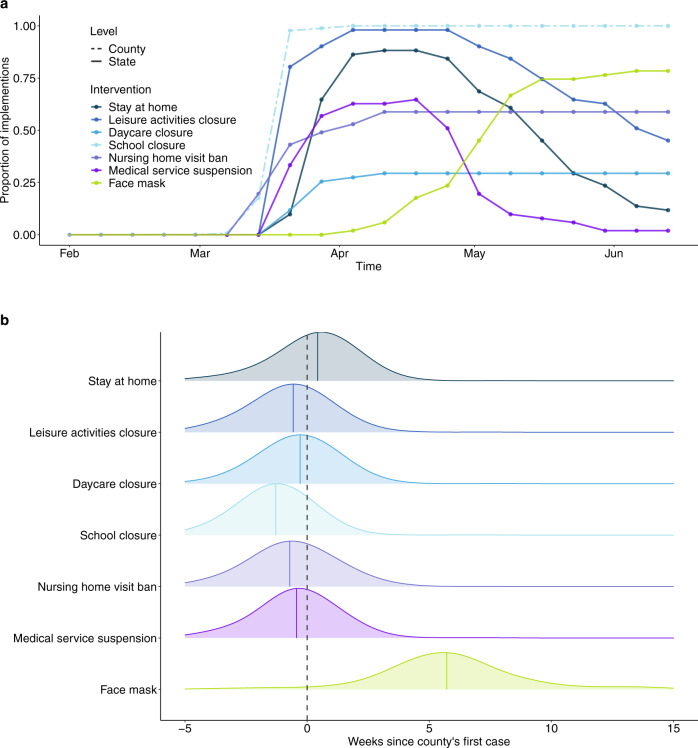
Fig. 2. Temporal distributions of non-pharmaceutical interventions.
a Time series of the proportion of states and counties where interventions were implemented. The color denotes the non-pharmaceutical intervention at county- (dashed) or state- (solid) level. b Distribution of time differences between intervention times and the occurrence of the county’s first confirmed case. Colored, solid lines indicate the median difference times of each intervention. Dashed vertical line indicates the week when the county reported its first case.

