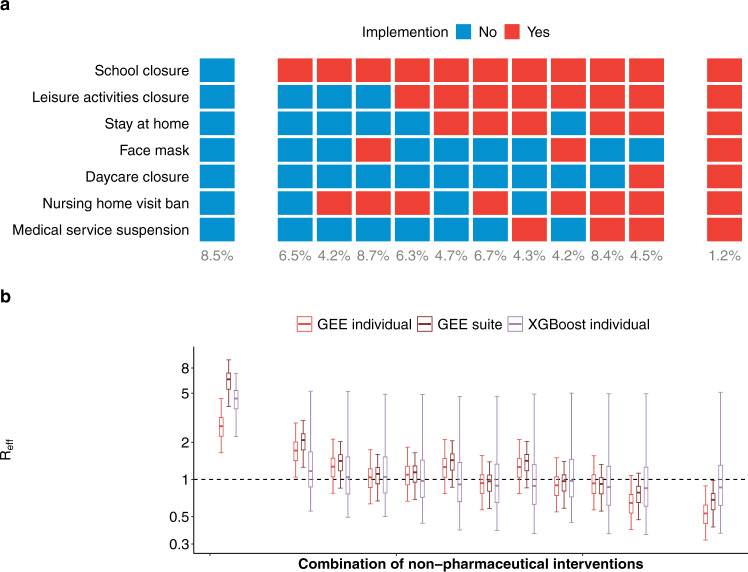
Fig. 4. Prediction of reproduction numbers (Reff) associated with different non-pharmaceutical interventions (NPIs) suites.
a Non-pharmaceutical interventions (NPIs) suites: no intervention (left column), all interventions (right column) and the ten most frequently used NPI suites in counties in the United States (middle columns; ordered by number of NPIs implemented (red; otherwise, blue) in each suite). Numbers below the columns are percentages of county-weeks in the study in which the suites were active. b Reff with different NPI suites (n = 34,778 county-weeks). Median (cross), interquartile range (boxes) and 95% quantile range (vertical lines) of Reff were distributions of predictions from the main model fitted with generalized estimation equations (GEEs, red, Fig. 3a), GEEs with NPIs fitted as suites (brown), and boosted decision tree (XGBoost individual, purple). X-axes are NPI suites that were shown in a. Horizontal dashed line indicates the threshold of one. Data are presented as median, interquartile, and 95% quantiles.

