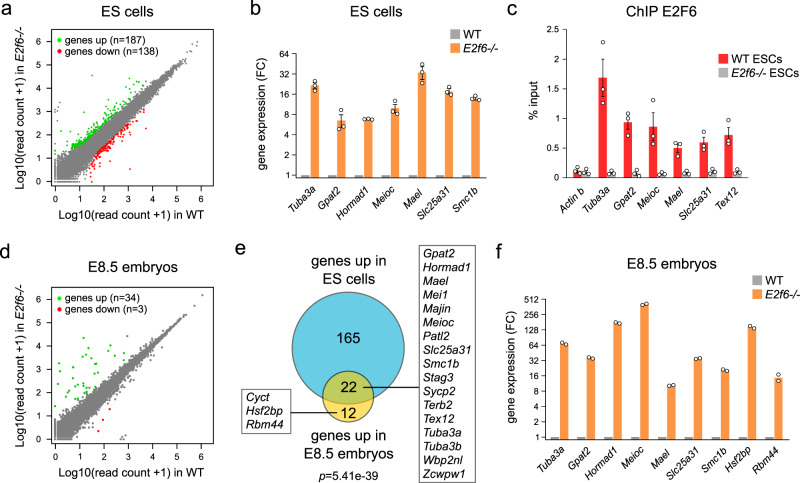
Fig. 2. Identification of genes repressed by E2F6 in ES cells and embryos.
a Scatter plot comparing the normalized RNA-seq read counts for all RefSeq genes in E2f6+/+ vs. E2f6−/− ESCs. Genes significantly upregulated or downregulated (fold change > 3; adjusted p-value < 0.0001) are highlighted in green and red, respectively. b Expression of E2F6 target genes by RT-qPCR in E2f6−/− ESCs. Shown is the fold change (FC) relative to WT cells (mean ± SEM, n = 3 independent experiments, expression normalized to Gusb, Rpl13a, and Mrpl32). c ChIP-qPCR analysis of the binding of E2F6 in the promoters of E2F6 target genes in WT and E2f6−/− ESCs (mean ± SEM, n = 3 independent experiments). d Scatter plot comparing the normalized RNA-seq read counts for all RefSeq genes in WT and E2f6−/− E8.5 embryos. Genes significantly upregulated or downregulated (fold change > 3; adjusted p-value < 0.0001) are highlighted in green and red, respectively. e Venn diagram comparing the genes upregulated in E2f6−/− ESCs and E2f6−/− embryos. The names of germline genes significantly upregulated in E2f6−/− ESCs and embryos or E2f6−/− embryos only are indicated. p-value: hypergeometric test. f Expression of E2F6 target genes by RT-qPCR in E2f6−/− embryos (mean fold change relative to WT, n = 2 embryos, expression normalized to Actb and Rpl13a). Source data are provided as a Source Data file.

