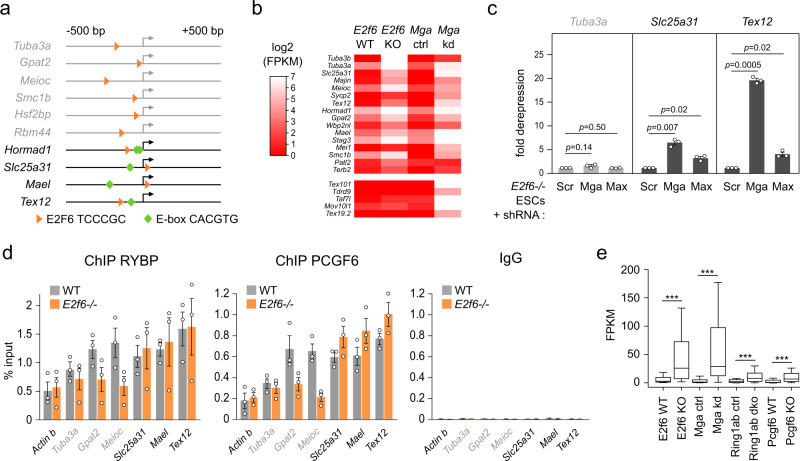
Fig. 3. Cooperation between E2F6 and MGA in ES cells.
a Position of E2F6-binding sites (orange triangles) and MAX E-boxes (green diamonds) in the promoter regions (−500 to +500 bp relative to the start of transcription) of E2F6 target genes. The arrow indicates the position of the TSS. The genes containing only an E2F6 motif are written in gray. b Heatmap comparing the changes in gene expression of germline genes in E2f6−/− and Mga-knockdown ESCs30. MGA represses the E2F6 target genes (top of the heatmap) but also other germline genes not repressed by E2F6 (bottom of the heatmap). c RT-qPCR quantification of the expression of E2F6 target genes without (Tuba3a) or with E-boxes (Slc25a31, Tex12) in E2f6−/− ESCs expressing an shRNA against MGA, MAX, or a scramble control (shRNA Scr). The results are represented as a fold change relative to the scramble control (mean ± SEM, n = 3 independent experiments, expression normalized to Actb). p-values: two-tailed t-test. d ChIP-qPCR analysis of the binding of RYBP and PCGF6 to promoters of E2F6 target genes in WT and E2f6−/− ESCs. The results are represented as the percentage of signal relative to the input (mean ± SEM, n = 3 independent experiments). For each condition, the values from the ChIP (left) and IgG control (right) are shown. The genes containing only an E2F6 motif are written in gray. e Gene expression (plotted as FPKM values) of E2F6 target germline genes (n = 24 genes) in E2f6-KO, Mga knockdown, Ring1a/b DKO, and Pcgf6-KO ESCs30 (paired Wilcoxon test, E2f6: p = 1.19e − 7, Mga: p = 2.38e − 7, Ring1a/b: p = 8.35e − 6, Pcgf6: p = 1.19e − 7). In the boxplots, the line indicates the median, the box limits indicate the upper and lower quartiles, and the whiskers extend to 1.5 IQR from the quartiles. Source data are provided as a Source Data file.

