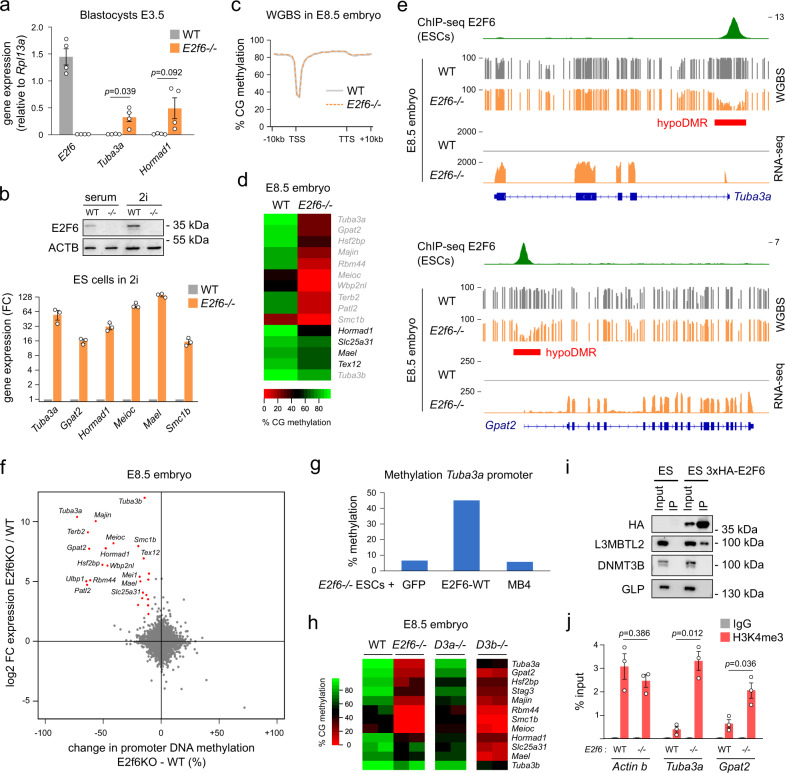
Fig. 5. E2F6 facilitates de novo DNA methylation of germline genes during development.
a RT-qPCR analysis of the expression of E2f6 and two E2F6 target genes in WT and E2f6−/− blastocysts (mean ± SEM, n = 4 blastocysts, expression normalized to Rpl13a). p-values: two-tailed t-test. b RT-qPCR analysis of E2F6 target genes in WT and E2f6−/− ESCs cultivated in 2i medium, represented as a fold change relative to WT (mean ± SEM, n = 3, expression normalized to Gusb, Rpl13a, and Mrpl32). A western blot showing E2F6 expression in ESCs cultivated in serum or 2i conditions is shown above the graph. c Metaplot showing the average percentage of CpG methylation measured by WGBS over RefSeq genes and 10 kb of flanking sequences in WT and E2f6−/− E8.5 embryos. d Heatmap representing the percentage of CpG methylation measured by WGBS in the promoters (−500 to +500 bp from the TSS) of E2F6 target genes in WT and E2f6−/− E8.5 embryos. The genes written in gray contain only an E2F6 motif in their promoter and the genes in black contain an E2F6 and E-box motif. e Genome tracks of E2F6 ChIP-seq (ESCs), WGBS, and RNA-seq in E8.5 embryos over two E2F6 target genes. Hypomethylated DMRs (hypoDMRs) are depicted by red rectangles. f Comparison of the changes in gene expression and promoter DNA methylation (measured by WGBS in −500 to +500 bp from the TSS) in E2f6−/− compared to WT E8.5 embryos for all genes. The genes simultaneously overexpressed (log2FC > 2) and hypomethylated (< −10%) are highlighted in red. g Quantification of DNA methylation in the Tuba3a promoter by pyrosequencing in E2f6−/− ES cells rescued with an empty vector (GFP), E2F6-WT, or the E2F6-MB4 mutant. h Heatmap of RRBS methylation scores in the promoter of E2F6 target genes in E8.5 embryo knockout for E2f6, Dnmt3a, or Dnmt3b3. Each column represents an independent embryo. i Co-immunoprecipitation experiments to investigate the interaction between E2F6 and DNMT3B. Immunoprecipitation was performed with an anti-HA antibody on nuclear extracts from control ESCs and ESCs expressing 3×HA-E2F6. Western blotting was performed on the input and immunoprecipitates using anti-HA, anti-L3MBTL2, anti-DNMT3B, and anti-GLP antibodies. j ChIP-qPCR analysis of H3K4me3 levels in the promoters of Actin b, Tuba3a, and Gpat2 in WT and E2f6−/− ES cells (mean ± SEM, n = 3). p-values: two-tailed t-test. Source data are provided as a Source Data file.

