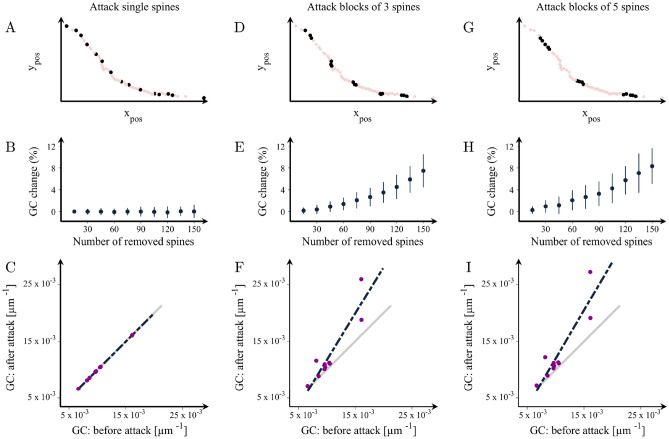
Figure 6.
Changes in the mean grouping coefficient after random attacks of spines in healthy dendrites. Illustration of attacks on random spines in a representative dendrite in groups of (A) 1, (D) 3 and (G) 5. (B,E,H) Percentage increases in the mean grouping coefficient (GC) in that dendrite as a function of the number of removed spines in the three cases respectively. Mean grouping coefficient of the attacked vs. healthy dendrites after the removal of 150 spines in groups of (C) 1, (F) 3 and (I) 5. The grey line shows the theoretical line of no change in the grouping coefficient, while the black line is the line that best fits the observed data after the attacks. This figure shows results for dendrite no. 2; the complete set of results for each SomaTau- dendrite are shown in Supplementary Table S5. Means and standard deviations are computed over 100 random attacks.

