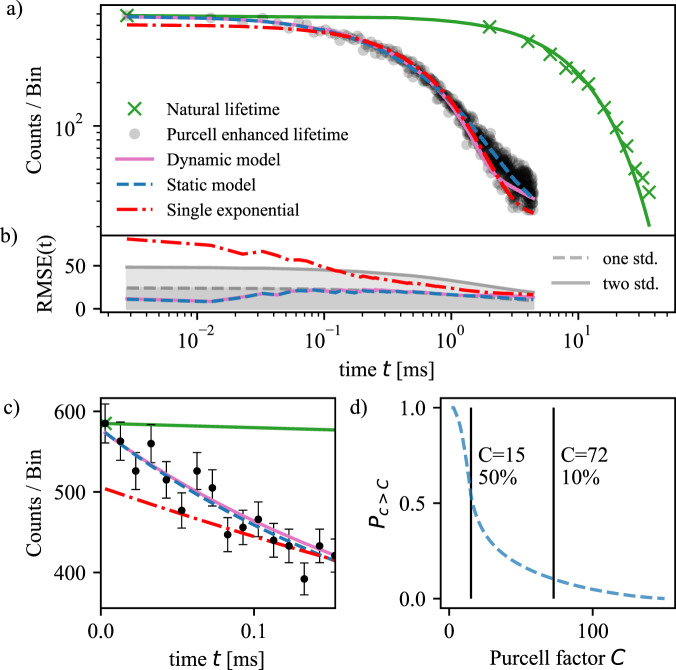
Fig. 2. Purcell enhanced lifetime measurements.
a Black points and green crosses correspond to the natural and Purcell enhanced lifetime measurements. Dash-dotted red line: Single exponential fit. Solid magenta and dashed blue line are the dynamic and static model, respectively. b Gray lines correspond to one and two standard deviation calculated by summing all the counts in the detection window [t0, t] of the Purcell enhanced lifetime measurement (black points), where t0 is the time at which the photon counting is started, and considering Poissonian counting statistics. Root-mean-square error (RMSE) of the single exponential, the static, and the dynamic models, also calculated as function of the detection time window. The single exponential fit deviates by more than two standard deviations at earlier times, while the model and the reconstructed decaying curve stay below this threshold. c Zoom of the first 150 μs of the plot shown in (a). Error bars represent one standard deviation calculated from Poisson counting statistics. d Estimated probability Pc>C that a given ion decays with a Purcell factor c > C.

