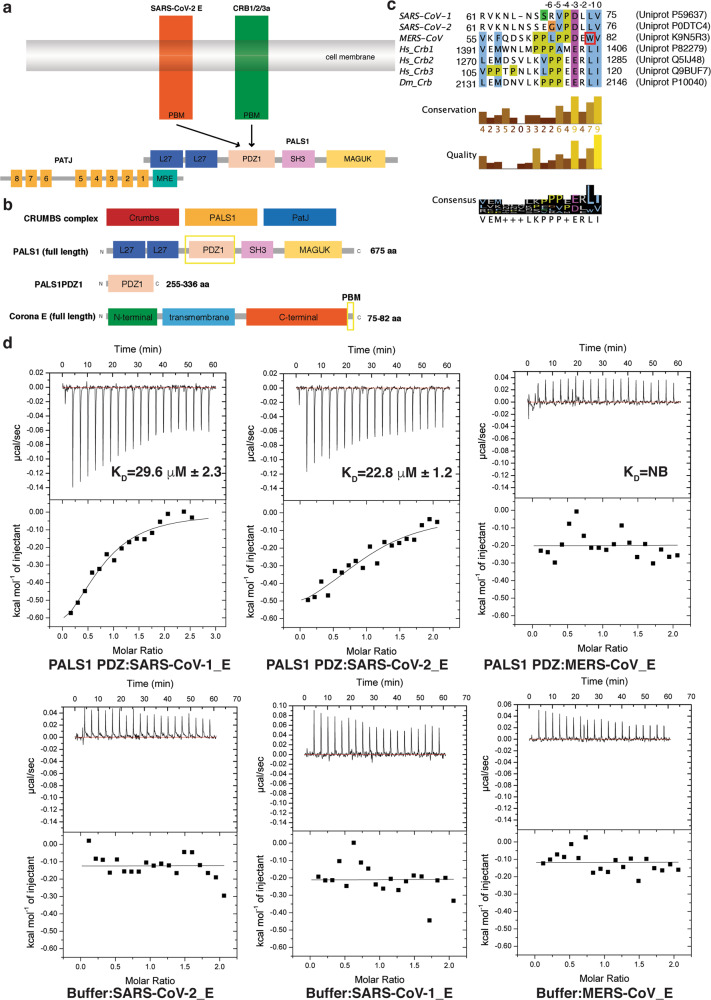
Fig. 1. Interactions of PALS1 PDZ domain with SARS-CoV-1, SARS-CoV-2 and MERS-CoV E protein PBM.
a Schematic outline of Crumb’s complex interactions. b Domain organization of PALS1 and SARS-CoV-2 E protein. c Sequence alignment of C-terminal PBM motifs of coronavirus E proteins with human (hs) crumbs isoforms and D. melanogaster (dm) crumbs. Trp81 in the MERS CoV E protein is boxed in red. PBM sequences are numbered above the alignment with the first C-terminal residue designated as 0, with preceding residues numbered −1, −2, −3 etc. Uniprot accession numbers and sequence boundaries are listed for all sequences. Residue colouring is as follows: blue for hydrophobic, magenta for a negative charge, red for positive charge, yellow for prolines and white for unconserved. Three different conservation metrics calculated by Jalview are shown. Quality score is calculated for each column in an alignment by summing, for all mutations, the ratio of the two BLOSUM 62 scores for a mutation pair and each residue’s conserved BLOSUM62 score, and then plotted on a scale from 0 to 1. The consensus displayed below the alignment is the percentage of the modal residue per column. The alignment was generated using Clustal Omega44 followed by analysis using Jalview45. d Binding profiles of isolated PALS1 PDZ domain interaction with coronavirus E protein PBM peptides are displayed. Each profile is represented by a raw thermogram (top panel) and a binding isotherm fitted with a one-site binding model (bottom panels). KD dissociation constant, ± standard deviation, NB no binding. Each of the values was calculated from at least three independent experiments. Top panels show peptide into protein titrations, bottom panels show peptide into buffer control titrations.

