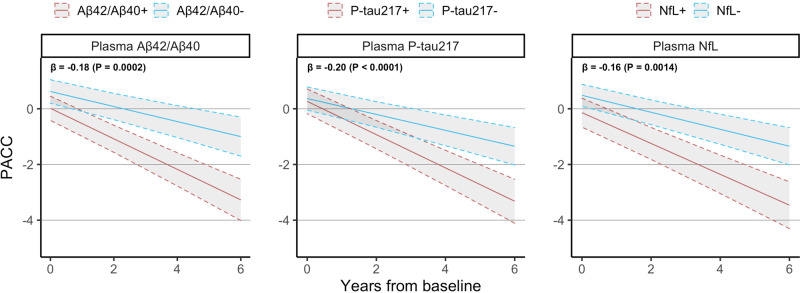
Fig. 1. Relationship between plasma biomarkers and change in PACC.
This figure shows the longitudinal PACC trajectory expected for a biomarker-negative or biomarker-positive CU individual with average age, average education, and female sex. β-coefficients at the top left of each panel are presented in terms of “points/year per standard deviation change in biomarker value” and are derived from linear mixed effects models with longitudinal PACC as outcome and age, sex, education, plus each plasma biomarker included separately from each other as predictors. All statistical tests were two-sided with no adjustment for multiple comparisons. Shaded areas represent 95% confidence intervals of the regression lines.

