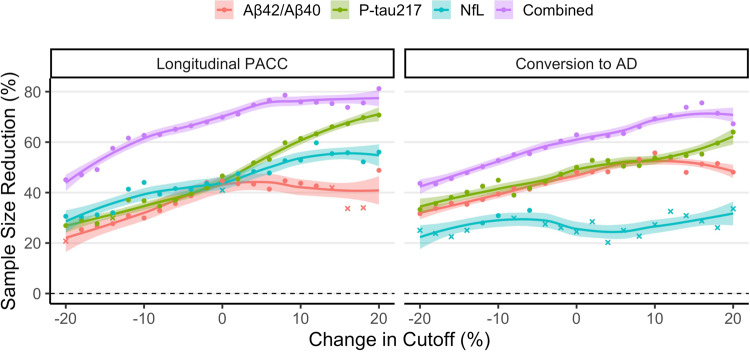
Fig. 4. Effect of inclusion threshold variability on biomarker effectiveness.
This figure shows the effect that varying the inclusion threshold by 20% in either direction of the pre-defined cutoffs has on the reduction in sample size in a theoretical clinical trial using biomarkers for inclusion enrichment. The reduction in sample size is compared to an unenriched trial with PACC or conversion to AD dementia as primary outcome. For datapoints in the figure, “circles” represent cutoffs for which the required sample size was significantly reduced, while “crosses” represent cutoffs for which required sample size was not significantly reduced. Shaded areas represent 95% confidence intervals of the loess regression lines fit over the entire data range.

