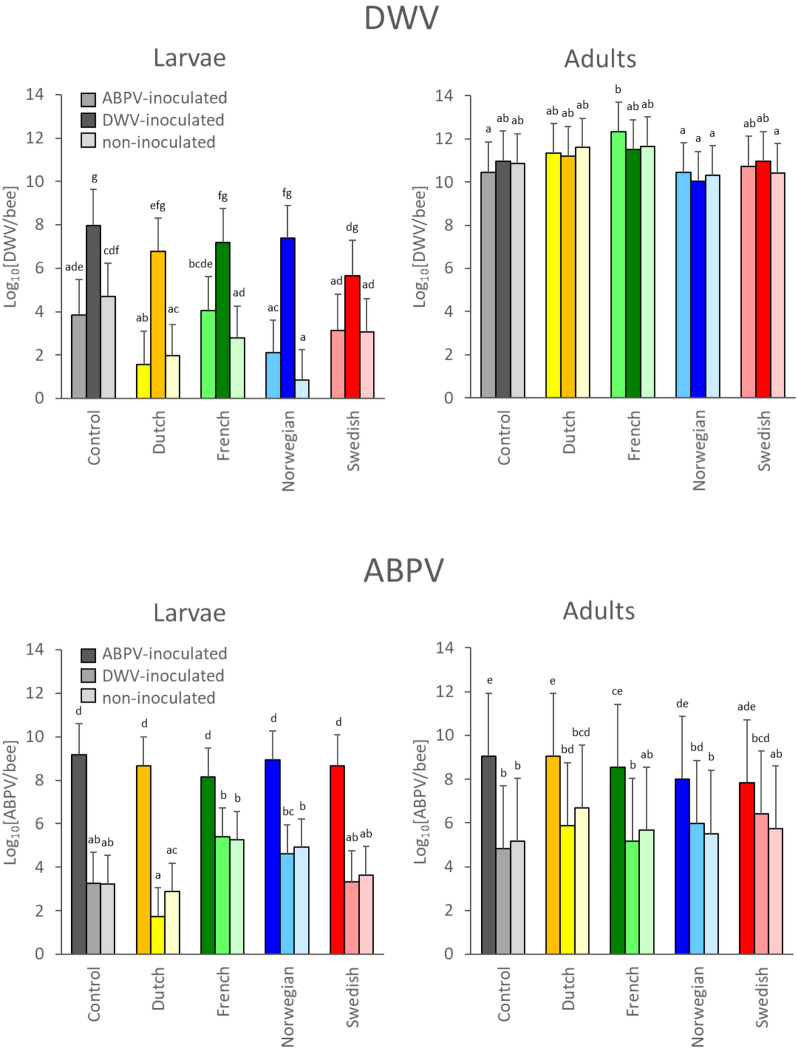
Figure 1.
Graphical representation of the DWV (top panels) and ABPV (bottom panels) titres pooled across the entire larval (left panels) and adult (right panels) infection time-course experiments for the virus-susceptible Control population (grey) and the Dutch (yellow), French (green), Norwegian (blue) and Swedish (red) varroa-resistant populations. The dark bars concern the data where the PCR assay detects the inoculated virus. The other bars concern the data where the PCR assay detects background virus, either in the non-inoculated control series (light bars) or the series inoculated with the alternate virus (medium bars). The mean values were estimated using Generalized Linear Mixed Models with time and colony as a random factor and colony-level phoretic varroa infestation rate as an explanatory factor. The error bars represent the 95% confidence interval on the estimate. The letters are used to identify differences between population and inoculation combinations within each virus-life stage combination.

